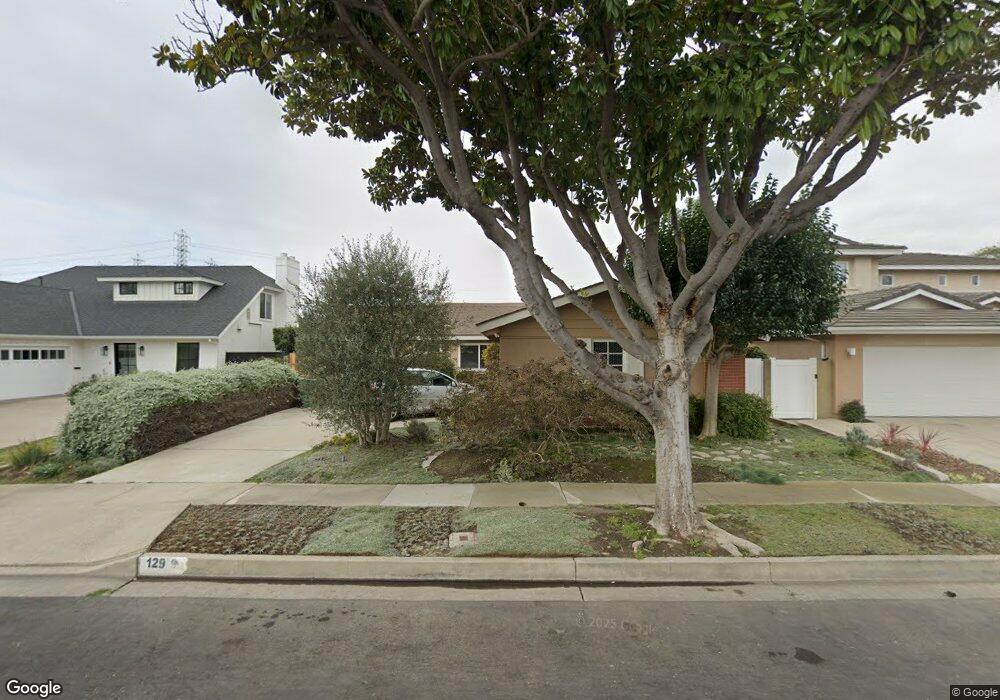
129 Stanford Ln Seal Beach, CA 90740
Estimated Value: $1,028,000 - $1,443,000
4
Beds
2
Baths
1,539
Sq Ft
$814/Sq Ft
Est. Value
About This Home
This home is located at 129 Stanford Ln, Seal Beach, CA 90740 and is currently estimated at $1,252,606, approximately $813 per square foot. 129 Stanford Ln is a home located in Orange County with nearby schools including Francis Hopkinson Elementary School, Jack L. Weaver Elementary School, and Oak Middle School.
Ownership History
Date
Name
Owned For
Owner Type
Purchase Details
Closed on
Jan 11, 2002
Sold by
Littell Wendy Leigh
Bought by
Bounds Gary
Current Estimated Value
Home Financials for this Owner
Home Financials are based on the most recent Mortgage that was taken out on this home.
Original Mortgage
$348,000
Interest Rate
7.17%
Purchase Details
Closed on
Dec 7, 2001
Sold by
Petty Ruthe and Petty John Christopher
Bought by
Bounds Gary
Home Financials for this Owner
Home Financials are based on the most recent Mortgage that was taken out on this home.
Original Mortgage
$348,000
Interest Rate
7.17%
Purchase Details
Closed on
Jun 28, 2001
Sold by
Montaine Stanley
Bought by
Petty Ruthe and Petter John Christopher
Home Financials for this Owner
Home Financials are based on the most recent Mortgage that was taken out on this home.
Original Mortgage
$264,000
Interest Rate
7.09%
Purchase Details
Closed on
Oct 17, 1996
Sold by
Stanley Montaine and Stanley Anne
Bought by
Montaine Stanley and Montaine Anne
Create a Home Valuation Report for This Property
The Home Valuation Report is an in-depth analysis detailing your home's value as well as a comparison with similar homes in the area
Home Values in the Area
Average Home Value in this Area
Purchase History
| Date | Buyer | Sale Price | Title Company |
|---|---|---|---|
| Bounds Gary | -- | First Southwestern Title Co | |
| Bounds Gary | $435,000 | First Southwestern Title Co | |
| Petty Ruthe | $330,000 | Fidelity National Title Ins | |
| Montaine Stanley | -- | -- | |
| Montaine Stanley | -- | -- |
Source: Public Records
Mortgage History
| Date | Status | Borrower | Loan Amount |
|---|---|---|---|
| Previous Owner | Bounds Gary | $348,000 | |
| Previous Owner | Petty Ruthe | $264,000 | |
| Closed | Bounds Gary | $43,500 |
Source: Public Records
Tax History Compared to Growth
Tax History
| Year | Tax Paid | Tax Assessment Tax Assessment Total Assessment is a certain percentage of the fair market value that is determined by local assessors to be the total taxable value of land and additions on the property. | Land | Improvement |
|---|---|---|---|---|
| 2025 | $7,527 | $642,615 | $539,166 | $103,449 |
| 2024 | $7,527 | $630,015 | $528,594 | $101,421 |
| 2023 | $7,353 | $617,662 | $518,229 | $99,433 |
| 2022 | $7,319 | $605,551 | $508,067 | $97,484 |
| 2021 | $7,160 | $593,678 | $498,105 | $95,573 |
| 2020 | $7,180 | $587,591 | $492,997 | $94,594 |
| 2019 | $6,922 | $576,070 | $483,330 | $92,740 |
| 2018 | $6,604 | $564,775 | $473,853 | $90,922 |
| 2017 | $6,464 | $553,701 | $464,561 | $89,140 |
| 2016 | $6,338 | $542,845 | $455,452 | $87,393 |
| 2015 | $6,266 | $534,691 | $448,610 | $86,081 |
| 2014 | $6,047 | $524,218 | $439,823 | $84,395 |
Source: Public Records
Map
Nearby Homes
- 13061 Oak Hills Dr Unit 221D
- 13021 Oak Hills Dr Unit 219H
- 1075 Brookline Rd
- 13081 Oak Hills Dr
- 6911 E 10th St
- 1100 Brookline Rd
- 12725 Martha Ann Dr
- 13160 Nassau Dr Unit 211L
- 13410 Oak Hills Dr Unit 224D
- 1121 Northwood Rd Unit 237A M9
- 13201 El Dorado Dr Unit 207-I
- 1150 Northwood Rd Unit 166E M7
- 865 Kallin Ave
- 12452 Martha Ann Dr
- 2692 Copa de Oro Dr
- 13261 Southport Ln
- 13171 St Andrews Dr Unit 154-J
- 13110 Seaview Ln Unit 245B
- 2762 Engel Dr
- 13380 El Dorado Dr