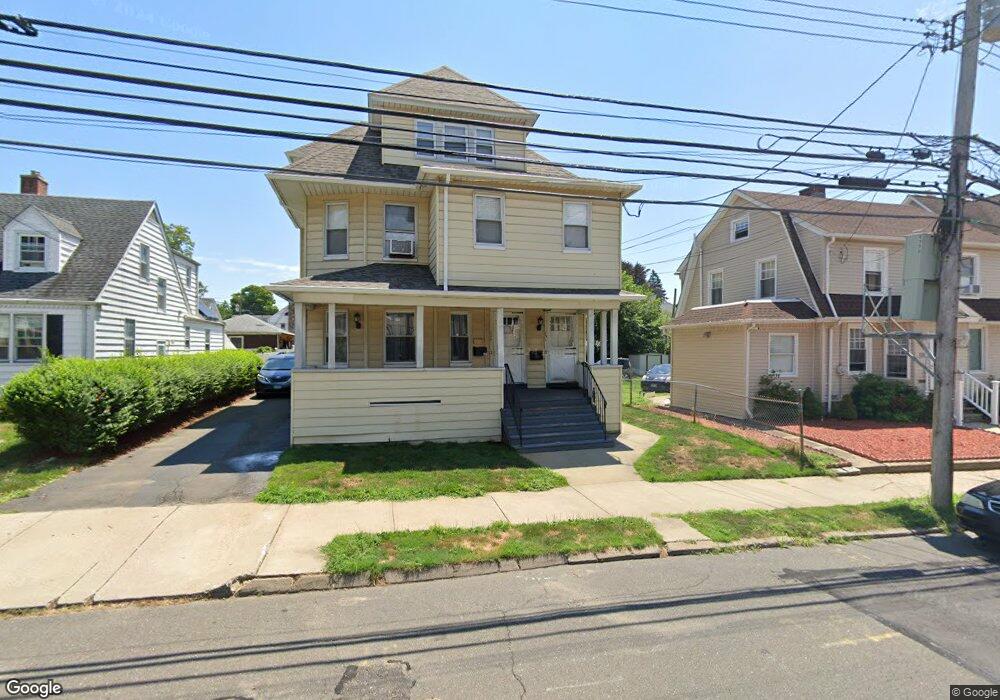
129 Thorme St Unit 131 Bridgeport, CT 06606
North End NeighborhoodEstimated Value: $510,941 - $736,000
6
Beds
3
Baths
3,326
Sq Ft
$189/Sq Ft
Est. Value
About This Home
This home is located at 129 Thorme St Unit 131, Bridgeport, CT 06606 and is currently estimated at $627,985, approximately $188 per square foot. 129 Thorme St Unit 131 is a home located in Fairfield County with nearby schools including Blackham School, Central High School, and St Andrew School.
Ownership History
Date
Name
Owned For
Owner Type
Purchase Details
Closed on
Dec 9, 1999
Sold by
Marini Tomasso and Marini Anna
Bought by
Nava Jose L and Flores Hermila
Current Estimated Value
Purchase Details
Closed on
Apr 18, 1994
Sold by
Napolitano Barbara and Napolitano John
Bought by
Marini Tomasso and Marini Anna
Create a Home Valuation Report for This Property
The Home Valuation Report is an in-depth analysis detailing your home's value as well as a comparison with similar homes in the area
Home Values in the Area
Average Home Value in this Area
Purchase History
| Date | Buyer | Sale Price | Title Company |
|---|---|---|---|
| Nava Jose L | $192,000 | -- | |
| Nava Jose L | $192,000 | -- | |
| Marini Tomasso | $135,000 | -- | |
| Marini Tomasso | $135,000 | -- |
Source: Public Records
Mortgage History
| Date | Status | Borrower | Loan Amount |
|---|---|---|---|
| Closed | Marini Tomasso | $141,083 | |
| Closed | Marini Tomasso | $20,000 | |
| Closed | Marini Tomasso | $193,325 |
Source: Public Records
Tax History
| Year | Tax Paid | Tax Assessment Tax Assessment Total Assessment is a certain percentage of the fair market value that is determined by local assessors to be the total taxable value of land and additions on the property. | Land | Improvement |
|---|---|---|---|---|
| 2025 | $9,620 | $221,400 | $75,310 | $146,090 |
| 2024 | $9,620 | $221,400 | $75,310 | $146,090 |
| 2023 | $9,620 | $221,400 | $75,310 | $146,090 |
| 2022 | $9,620 | $221,400 | $75,310 | $146,090 |
| 2021 | $9,620 | $221,400 | $75,310 | $146,090 |
| 2020 | $8,733 | $161,760 | $39,340 | $122,420 |
| 2019 | $8,733 | $161,760 | $39,340 | $122,420 |
| 2018 | $8,795 | $161,760 | $39,340 | $122,420 |
| 2017 | $8,795 | $161,760 | $39,340 | $122,420 |
| 2016 | $8,795 | $161,760 | $39,340 | $122,420 |
| 2015 | $9,297 | $220,300 | $47,600 | $172,700 |
| 2014 | $9,297 | $220,300 | $47,600 | $172,700 |
Source: Public Records
Map
Nearby Homes
- 3461 Main St
- 120 Clark St
- 45 Stevens St Unit 3L
- 95 Savoy St
- 1265 Lindley St
- 234 Savoy St
- 457 Summit St
- 25 Westfield Ave
- 26 Marsdale Ave
- 578 Beechmont Ave
- 355 Exeter St
- 213 Exeter St
- 219 Exeter St
- 420 Greenwood St
- 240 Valley Ave
- 1095 Wayne St
- 208 Fairview Ave Unit 210
- 315 Tesiny Ave
- 329 Ezra St
- 405 Westfield Ave
Your Personal Tour Guide
Ask me questions while you tour the home.