U
Seller's Agent in 2017
UNREPRESENTED Properties
Unrepresented Properties
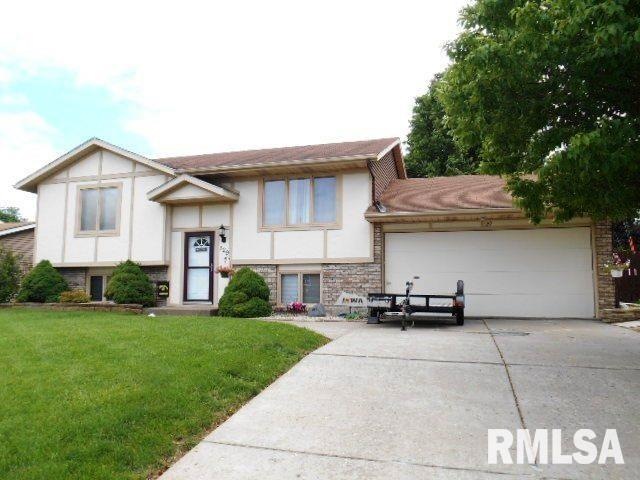
Estimated Value: $190,065 - $319,000
For comp purposes only. 3 bedroom split foyer with den and great back yard with patio and fenced yard
Last Agent to Sell the Property
UNREPRESENTED Properties
Unrepresented Properties License #0000 Listed on: 10/13/2017
| Date | Buyer | Sale Price | Title Company |
|---|---|---|---|
| Ryan Angela | -- | None Available |
| Date | Event | Price | List to Sale | Price per Sq Ft |
|---|---|---|---|---|
| 10/13/2017 10/13/17 | Sold | $141,900 | 0.0% | $171 / Sq Ft |
| 10/13/2017 10/13/17 | Pending | -- | -- | -- |
| 10/13/2017 10/13/17 | For Sale | $141,900 | -- | $171 / Sq Ft |
| Year | Tax Paid | Tax Assessment Tax Assessment Total Assessment is a certain percentage of the fair market value that is determined by local assessors to be the total taxable value of land and additions on the property. | Land | Improvement |
|---|---|---|---|---|
| 2025 | $2,772 | $182,620 | $35,420 | $147,200 |
| 2024 | $3,647 | $165,300 | $35,420 | $129,880 |
| 2023 | $4,378 | $165,300 | $35,420 | $129,880 |
| 2022 | $4,045 | $154,590 | $25,760 | $128,830 |
| 2021 | $3,126 | $154,590 | $25,760 | $128,830 |
| 2020 | $3,321 | $143,160 | $25,760 | $117,400 |
| 2019 | $3,099 | $136,930 | $25,760 | $111,170 |
| 2018 | $2,799 | $136,930 | $25,760 | $111,170 |
| 2017 | $2,636 | $129,660 | $25,760 | $103,900 |
| 2016 | $2,690 | $124,470 | $0 | $0 |
| 2015 | $2,536 | $124,360 | $0 | $0 |
| 2014 | $2,568 | $124,360 | $0 | $0 |
| 2013 | $2,520 | $0 | $0 | $0 |
| 2012 | -- | $115,440 | $32,300 | $83,140 |
U
Seller's Agent in 2017
UNREPRESENTED Properties
Unrepresented Properties

Buyer's Agent in 2017
Brenda O'Neil
NextHome QC Realty
(563) 529-2727
23 in this area
92 Total Sales
Source: RMLS Alliance
MLS Number: RMAQC4187177
APN: P1404A42
Disclaimer: Certain information contained herein is derived from information provided by parties other than Homes.com. All information provided is deemed reliable, but is not guaranteed to be accurate and should be independently verified.
![]() IDX information is provided exclusively for personal, non-commercial use, and may not be used for any purpose other than to identify prospective properties consumers may be interested in purchasing. Information is deemed reliable but not guaranteed.
IDX information is provided exclusively for personal, non-commercial use, and may not be used for any purpose other than to identify prospective properties consumers may be interested in purchasing. Information is deemed reliable but not guaranteed.