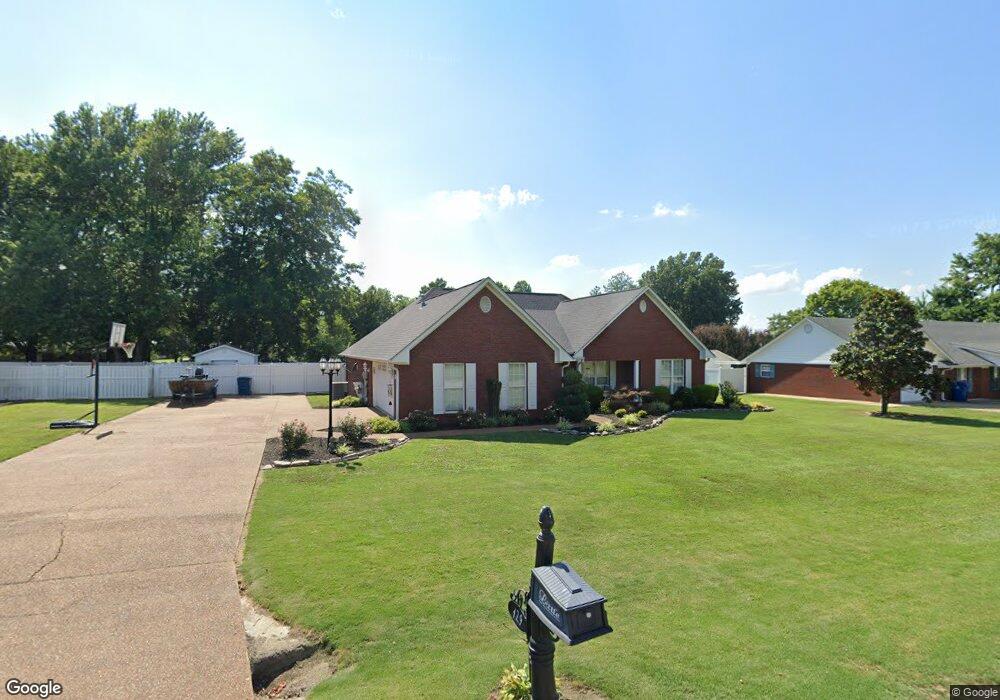
129 Waldunn Cove Rutherford, TN 38369
Estimated Value: $240,001 - $340,000
--
Bed
2
Baths
2,088
Sq Ft
$141/Sq Ft
Est. Value
About This Home
This home is located at 129 Waldunn Cove, Rutherford, TN 38369 and is currently estimated at $294,500, approximately $141 per square foot. 129 Waldunn Cove is a home located in Gibson County with nearby schools including Rutherford Elementary School and Gibson County High School.
Ownership History
Date
Name
Owned For
Owner Type
Purchase Details
Closed on
May 17, 2016
Sold by
Greene Michael C
Bought by
Little Travis W and Little Whitney B
Current Estimated Value
Home Financials for this Owner
Home Financials are based on the most recent Mortgage that was taken out on this home.
Original Mortgage
$144,000
Outstanding Balance
$114,372
Interest Rate
3.59%
Mortgage Type
New Conventional
Estimated Equity
$180,128
Purchase Details
Closed on
Aug 6, 2008
Sold by
Davidson Amanda
Bought by
Greene Michael
Home Financials for this Owner
Home Financials are based on the most recent Mortgage that was taken out on this home.
Original Mortgage
$163,922
Interest Rate
6.32%
Purchase Details
Closed on
Dec 24, 1999
Sold by
Dunn Wallace
Bought by
Davidson Amanda
Purchase Details
Closed on
Mar 19, 1991
Bought by
Dunn Wallace and Dunn Shirley
Create a Home Valuation Report for This Property
The Home Valuation Report is an in-depth analysis detailing your home's value as well as a comparison with similar homes in the area
Home Values in the Area
Average Home Value in this Area
Purchase History
| Date | Buyer | Sale Price | Title Company |
|---|---|---|---|
| Little Travis W | $160,000 | -- | |
| Greene Michael | $170,000 | -- | |
| Davidson Amanda | $9,000 | -- | |
| Dunn Wallace | $9,000 | -- |
Source: Public Records
Mortgage History
| Date | Status | Borrower | Loan Amount |
|---|---|---|---|
| Open | Little Travis W | $144,000 | |
| Previous Owner | Dunn Wallace | $163,922 |
Source: Public Records
Tax History Compared to Growth
Tax History
| Year | Tax Paid | Tax Assessment Tax Assessment Total Assessment is a certain percentage of the fair market value that is determined by local assessors to be the total taxable value of land and additions on the property. | Land | Improvement |
|---|---|---|---|---|
| 2024 | $2,147 | $62,225 | $3,200 | $59,025 |
| 2023 | $1,282 | $41,200 | $2,875 | $38,325 |
| 2022 | $1,253 | $41,200 | $2,875 | $38,325 |
| 2021 | $1,253 | $41,200 | $2,875 | $38,325 |
| 2020 | $2,052 | $41,200 | $2,875 | $38,325 |
| 2019 | $1,990 | $41,200 | $2,875 | $38,325 |
| 2018 | $2,019 | $40,625 | $2,875 | $37,750 |
| 2017 | $1,958 | $40,625 | $2,875 | $37,750 |
| 2016 | $1,998 | $40,625 | $2,875 | $37,750 |
| 2015 | $1,781 | $40,625 | $2,875 | $37,750 |
| 2014 | $1,764 | $40,225 | $2,875 | $37,350 |
Source: Public Records
Map
Nearby Homes
- 407 Fain St
- 109 Smith Ave
- 624 W Main St
- 944 Mcknight St
- 511 W Knox St
- 403 W Knox St
- 404 Mcknight St
- 321 W Main St
- 130 Callis Dr
- 113 Mcknight St
- 112 Fox St
- 107 Hopper St
- 502 E Main St
- 901 S Trenton St
- 23 Gravettes Crossing Rd W
- 283 Tommy Duffy Loop
- 142 Joe Patterson Rd
- 305 Walnut Grove Rd
- 173 Orr Rd
- 0 Royal St