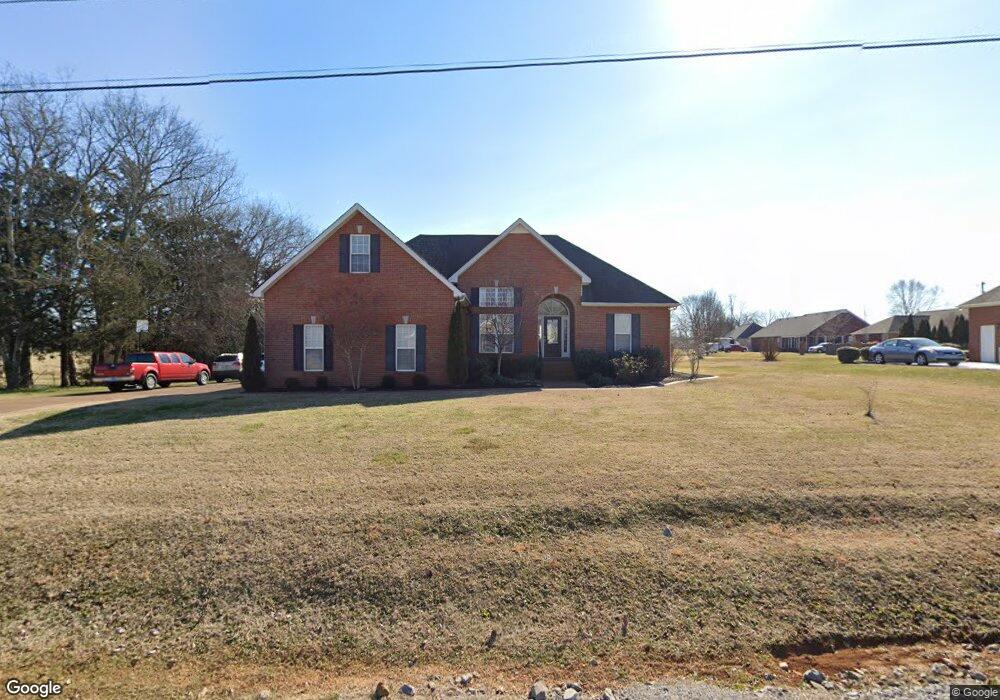
129 Whittle Ct Murfreesboro, TN 37128
Estimated Value: $458,533 - $506,000
--
Bed
3
Baths
1,862
Sq Ft
$259/Sq Ft
Est. Value
About This Home
This home is located at 129 Whittle Ct, Murfreesboro, TN 37128 and is currently estimated at $482,633, approximately $259 per square foot. 129 Whittle Ct is a home located in Rutherford County with nearby schools including Barfield Elementary School, Rockvale Middle School, and Rockvale High School.
Ownership History
Date
Name
Owned For
Owner Type
Purchase Details
Closed on
Feb 28, 2003
Sold by
Fields Virginia A
Bought by
Mccaghren Marcus L and Mccaghren Telowa L
Current Estimated Value
Home Financials for this Owner
Home Financials are based on the most recent Mortgage that was taken out on this home.
Original Mortgage
$144,350
Outstanding Balance
$62,056
Interest Rate
5.88%
Estimated Equity
$420,577
Purchase Details
Closed on
Jul 31, 2002
Sold by
Melvin Haynes Robert
Bought by
Fields Virginia A
Home Financials for this Owner
Home Financials are based on the most recent Mortgage that was taken out on this home.
Original Mortgage
$175,750
Interest Rate
6.52%
Purchase Details
Closed on
Mar 21, 2002
Sold by
Kidd and Teresa
Bought by
Haynes Robert M
Home Financials for this Owner
Home Financials are based on the most recent Mortgage that was taken out on this home.
Original Mortgage
$143,200
Interest Rate
6.8%
Create a Home Valuation Report for This Property
The Home Valuation Report is an in-depth analysis detailing your home's value as well as a comparison with similar homes in the area
Home Values in the Area
Average Home Value in this Area
Purchase History
| Date | Buyer | Sale Price | Title Company |
|---|---|---|---|
| Mccaghren Marcus L | $180,472 | -- | |
| Fields Virginia A | $185,000 | -- | |
| Haynes Robert M | $45,000 | -- |
Source: Public Records
Mortgage History
| Date | Status | Borrower | Loan Amount |
|---|---|---|---|
| Open | Haynes Robert M | $144,350 | |
| Previous Owner | Haynes Robert M | $175,750 | |
| Previous Owner | Haynes Robert M | $143,200 |
Source: Public Records
Tax History Compared to Growth
Tax History
| Year | Tax Paid | Tax Assessment Tax Assessment Total Assessment is a certain percentage of the fair market value that is determined by local assessors to be the total taxable value of land and additions on the property. | Land | Improvement |
|---|---|---|---|---|
| 2025 | $1,849 | $98,575 | $22,500 | $76,075 |
| 2024 | $1,849 | $98,575 | $22,500 | $76,075 |
| 2023 | $1,849 | $98,575 | $22,500 | $76,075 |
| 2022 | $1,593 | $98,575 | $22,500 | $76,075 |
| 2021 | $1,446 | $65,175 | $15,000 | $50,175 |
| 2020 | $1,446 | $65,175 | $15,000 | $50,175 |
| 2019 | $1,446 | $65,175 | $15,000 | $50,175 |
| 2018 | $1,368 | $62,675 | $0 | $0 |
| 2017 | $1,369 | $51,100 | $0 | $0 |
| 2016 | $1,369 | $51,100 | $0 | $0 |
| 2015 | $1,369 | $51,100 | $0 | $0 |
| 2014 | $1,271 | $51,100 | $0 | $0 |
| 2013 | -- | $54,000 | $0 | $0 |
Source: Public Records
Map
Nearby Homes
- 123 River Downs Blvd
- 2816 Campanella Dr
- 1455 Cotillion Dr
- 3506 Firerock Dr
- 3513 Firerock Dr
- 3515 Firerock Dr
- 3517 Firerock Dr
- 3514 Firerock Dr
- 3519 Firerock Dr
- 3516 Firerock Dr
- 2319 Murano Dr
- 1392 Suzanne Dr
- 3518 Firerock Dr
- 3521 Firerock Dr
- 3520 Firerock Dr
- 3522 Firerock Dr
- 2905 Eckersley Dr
- 3530 Firerock Dr
- 3536 Firerock Dr
- 3534 Firerock Dr