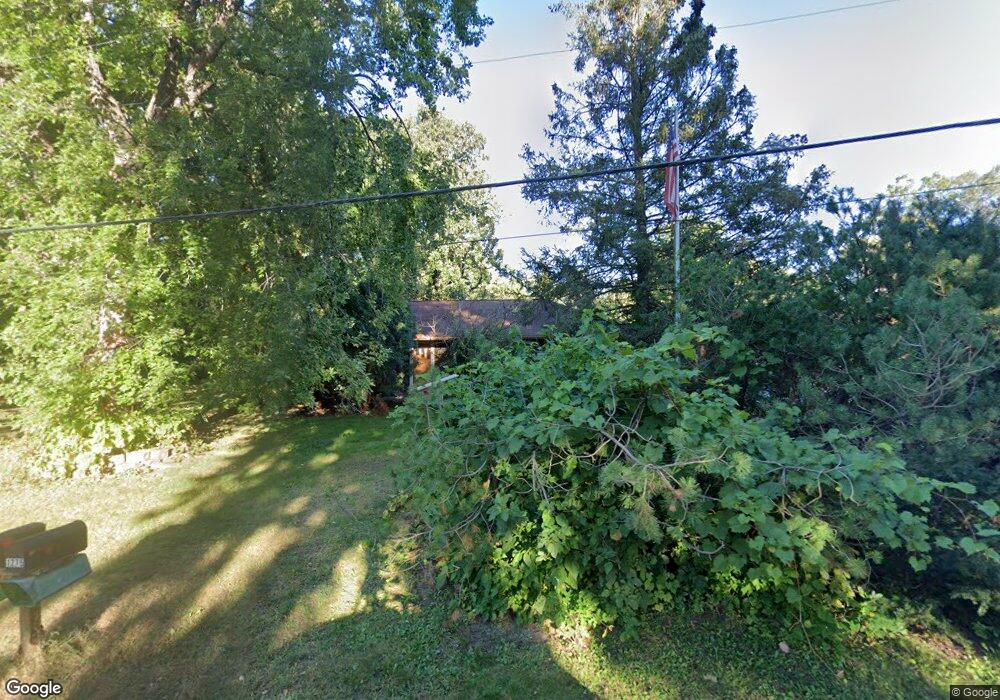
1290 3rd Ave Newport, MN 55055
Estimated Value: $283,000 - $304,000
3
Beds
1
Bath
1,160
Sq Ft
$252/Sq Ft
Est. Value
About This Home
This home is located at 1290 3rd Ave, Newport, MN 55055 and is currently estimated at $292,168, approximately $251 per square foot. 1290 3rd Ave is a home located in Washington County with nearby schools including Newport Elementary School, Oltman Middle School, and East Ridge High School.
Ownership History
Date
Name
Owned For
Owner Type
Purchase Details
Closed on
Jan 12, 2017
Sold by
Cassdy Poroperties Llc
Bought by
Rm Real Estate Llc
Current Estimated Value
Purchase Details
Closed on
Jul 31, 2001
Sold by
Flor Rose Ann
Bought by
Amsale Tegegne and Dejene Zenaye
Purchase Details
Closed on
Jul 9, 2001
Sold by
Leko David K and Leko Muriel M
Bought by
Brown Brothers Builders Llp
Purchase Details
Closed on
Jul 10, 2000
Sold by
Rygh Marlin R
Bought by
Flor Rose Ann
Create a Home Valuation Report for This Property
The Home Valuation Report is an in-depth analysis detailing your home's value as well as a comparison with similar homes in the area
Home Values in the Area
Average Home Value in this Area
Purchase History
| Date | Buyer | Sale Price | Title Company |
|---|---|---|---|
| Rm Real Estate Llc | $225,000 | Land Title Inc | |
| Amsale Tegegne | $160,000 | -- | |
| Brown Brothers Builders Llp | -- | -- | |
| Flor Rose Ann | $160,000 | -- |
Source: Public Records
Tax History Compared to Growth
Tax History
| Year | Tax Paid | Tax Assessment Tax Assessment Total Assessment is a certain percentage of the fair market value that is determined by local assessors to be the total taxable value of land and additions on the property. | Land | Improvement |
|---|---|---|---|---|
| 2024 | $3,342 | $229,300 | $71,000 | $158,300 |
| 2023 | $3,342 | $256,200 | $106,000 | $150,200 |
| 2022 | $3,104 | $238,300 | $103,500 | $134,800 |
| 2021 | $3,120 | $196,400 | $85,800 | $110,600 |
| 2020 | $3,396 | $202,000 | $95,500 | $106,500 |
| 2019 | $3,422 | $216,300 | $90,500 | $125,800 |
| 2018 | $3,306 | $208,000 | $90,500 | $117,500 |
| 2017 | $3,098 | $197,900 | $85,500 | $112,400 |
| 2016 | $2,984 | $188,400 | $80,500 | $107,900 |
| 2015 | $2,614 | $158,600 | $74,500 | $84,100 |
| 2013 | -- | $154,500 | $74,500 | $80,000 |
Source: Public Records
Map
Nearby Homes
- 1493 3rd Ave
- 1523 Cedar Ln
- 1391 12th Ave
- 1761 8th Ave
- 1403 Concord St S Unit 15
- 2250 Larry Ln
- 6310 Dawn Way
- 6162 Goodwin Ave N
- 15016 Ashtown Ln
- 6435 Dawn Way
- 6254 61st St S
- 6248 61st St S
- 6253 61st St S
- 6266 61st St S
- 6265 61st St S
- 6260 61st St S
- 6219 Highland Hills Ln S
- 10525 Goodwin Ave S
- 10513 Goodwin Ave S
- 10543 Goodwin Ave S