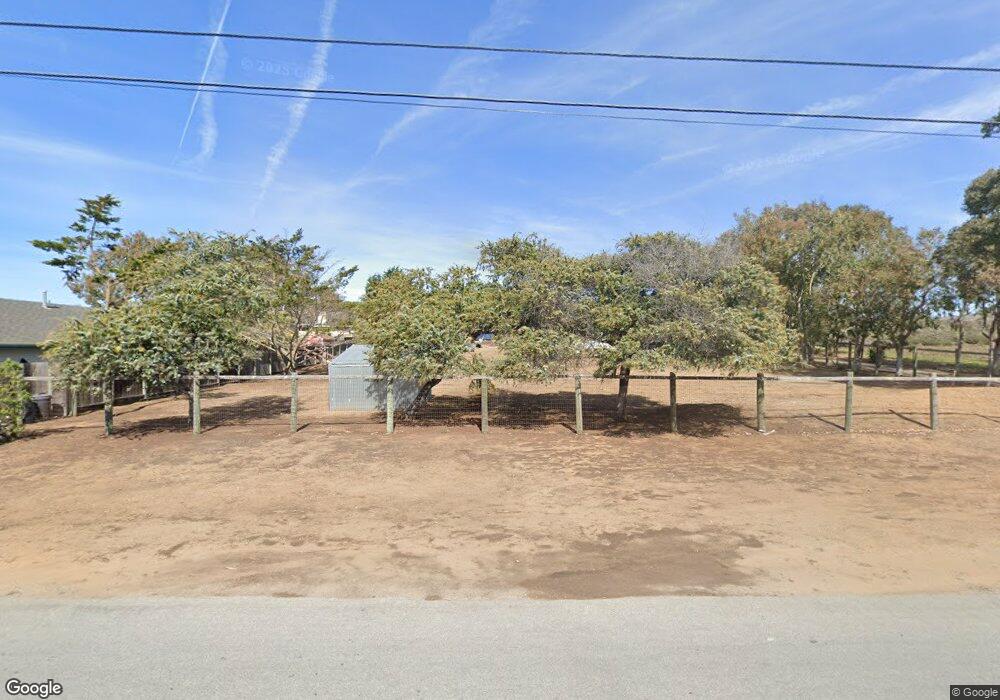
1290 Nipomo Ave Los Osos, CA 93402
Estimated Value: $1,243,000 - $1,495,000
4
Beds
4
Baths
2,679
Sq Ft
$516/Sq Ft
Est. Value
About This Home
This home is located at 1290 Nipomo Ave, Los Osos, CA 93402 and is currently estimated at $1,381,394, approximately $515 per square foot. 1290 Nipomo Ave is a home located in San Luis Obispo County with nearby schools including Baywood Elementary School, Los Osos Middle School, and Morro Bay High School.
Ownership History
Date
Name
Owned For
Owner Type
Purchase Details
Closed on
Jul 27, 2010
Sold by
Gahan Kevin Patrick
Bought by
Gahan John W
Current Estimated Value
Purchase Details
Closed on
Jul 2, 2010
Sold by
Gahan John W and Gahan James J
Bought by
Goldberg Andrew
Purchase Details
Closed on
Apr 2, 2008
Sold by
Gahan James Joseph
Bought by
Gahan James J
Purchase Details
Closed on
Dec 28, 2006
Sold by
Gahan James Joseph
Bought by
Gahan John W and Gahan James Joseph
Home Financials for this Owner
Home Financials are based on the most recent Mortgage that was taken out on this home.
Original Mortgage
$450,000
Interest Rate
6.16%
Mortgage Type
Unknown
Purchase Details
Closed on
Dec 5, 2006
Sold by
Gahan John W and Gahan Kevin Patrick
Bought by
Gahan James Joseph
Home Financials for this Owner
Home Financials are based on the most recent Mortgage that was taken out on this home.
Original Mortgage
$450,000
Interest Rate
6.16%
Mortgage Type
Unknown
Purchase Details
Closed on
Sep 15, 2004
Sold by
Vlach Wandalicia Mary
Bought by
Gahan John W and Gahan James Joseph
Home Financials for this Owner
Home Financials are based on the most recent Mortgage that was taken out on this home.
Original Mortgage
$115,000
Interest Rate
5.95%
Mortgage Type
Seller Take Back
Purchase Details
Closed on
Sep 13, 2004
Sold by
Gahan Kimberly and Gahan Michele Kim
Bought by
Gahan Kevin Patrick
Home Financials for this Owner
Home Financials are based on the most recent Mortgage that was taken out on this home.
Original Mortgage
$115,000
Interest Rate
5.95%
Mortgage Type
Seller Take Back
Purchase Details
Closed on
Jul 29, 2004
Sold by
Rossetti Gabriel J and Rossetti Jamie M
Bought by
Gahan John W
Home Financials for this Owner
Home Financials are based on the most recent Mortgage that was taken out on this home.
Original Mortgage
$115,000
Interest Rate
5.95%
Mortgage Type
Seller Take Back
Create a Home Valuation Report for This Property
The Home Valuation Report is an in-depth analysis detailing your home's value as well as a comparison with similar homes in the area
Home Values in the Area
Average Home Value in this Area
Purchase History
| Date | Buyer | Sale Price | Title Company |
|---|---|---|---|
| Gahan John W | $45,000 | First American Title Company | |
| Goldberg Andrew | $621,000 | First American Title Company | |
| Gahan James J | -- | None Available | |
| Gahan John W | -- | Cuesta Title Company | |
| Gahan James Joseph | $300,000 | Cuesta Title Company | |
| Gahan John W | $185,000 | Chicago Title Co | |
| Gahan Kevin Patrick | -- | Chicago Title Co | |
| Vlach Wandalecia Mary | -- | Chicago Title Co | |
| Gahan John W | $848,000 | Chicago Title Company |
Source: Public Records
Mortgage History
| Date | Status | Borrower | Loan Amount |
|---|---|---|---|
| Previous Owner | Gahan James Joseph | $450,000 | |
| Previous Owner | Gahan John W | $115,000 |
Source: Public Records
Tax History Compared to Growth
Tax History
| Year | Tax Paid | Tax Assessment Tax Assessment Total Assessment is a certain percentage of the fair market value that is determined by local assessors to be the total taxable value of land and additions on the property. | Land | Improvement |
|---|---|---|---|---|
| 2025 | $8,843 | $811,688 | $352,316 | $459,372 |
| 2024 | $8,681 | $795,773 | $345,408 | $450,365 |
| 2023 | $8,681 | $780,171 | $338,636 | $441,535 |
| 2022 | $8,138 | $764,875 | $331,997 | $432,878 |
| 2021 | $8,004 | $749,879 | $325,488 | $424,391 |
| 2020 | $7,921 | $742,191 | $322,151 | $420,040 |
| 2019 | $7,836 | $727,639 | $315,835 | $411,804 |
| 2018 | $7,522 | $698,667 | $309,643 | $389,024 |
| 2017 | $7,373 | $684,969 | $303,572 | $381,397 |
| 2016 | $7,226 | $671,539 | $297,620 | $373,919 |
| 2015 | $7,114 | $661,453 | $293,150 | $368,303 |
| 2014 | $6,538 | $648,497 | $287,408 | $361,089 |
Source: Public Records
Map
Nearby Homes