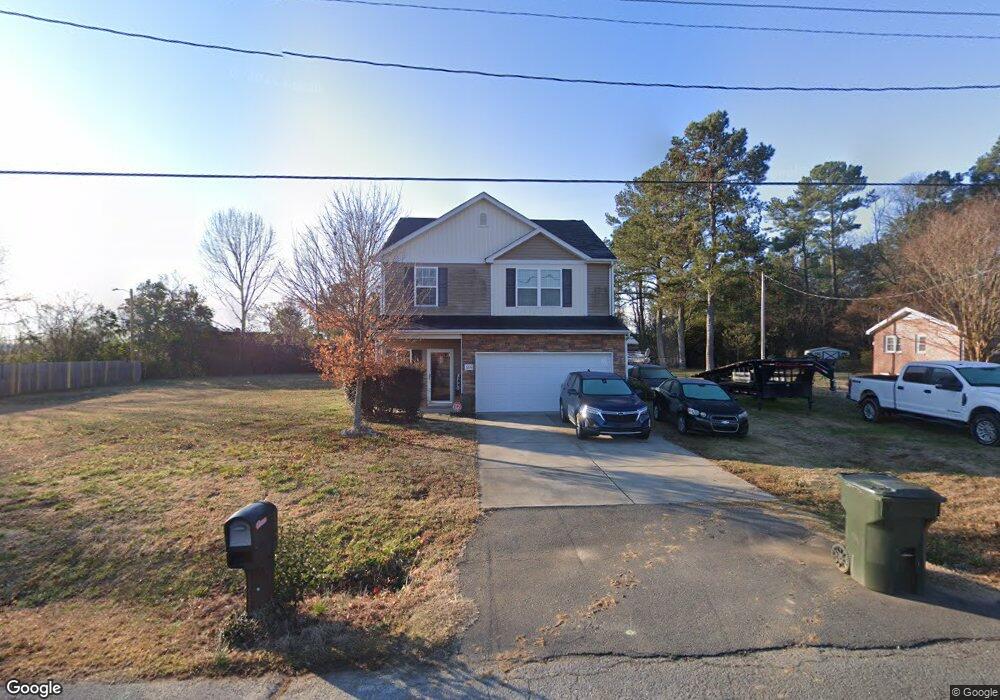
1290 Sullivan St Unit 11 Rock Hill, SC 29730
Estimated Value: $336,000 - $353,000
--
Bed
3
Baths
1,980
Sq Ft
$175/Sq Ft
Est. Value
About This Home
This home is located at 1290 Sullivan St Unit 11, Rock Hill, SC 29730 and is currently estimated at $347,154, approximately $175 per square foot. 1290 Sullivan St Unit 11 is a home located in York County with nearby schools including Castle Heights Middle School, Northwestern High School, and St. Anne Catholic School.
Ownership History
Date
Name
Owned For
Owner Type
Purchase Details
Closed on
Dec 7, 2018
Sold by
Dixon Kelly P
Bought by
Jones Cleon Brian
Current Estimated Value
Home Financials for this Owner
Home Financials are based on the most recent Mortgage that was taken out on this home.
Original Mortgage
$186,558
Outstanding Balance
$164,362
Interest Rate
4.8%
Mortgage Type
FHA
Estimated Equity
$182,792
Purchase Details
Closed on
Aug 1, 2014
Sold by
Oakmont Home Builders Inc
Bought by
Dixon Kelly P
Home Financials for this Owner
Home Financials are based on the most recent Mortgage that was taken out on this home.
Original Mortgage
$147,495
Interest Rate
4.16%
Mortgage Type
FHA
Purchase Details
Closed on
Mar 10, 2014
Sold by
Furr Elaine F
Bought by
Oakmont Home Builders Inc
Purchase Details
Closed on
Aug 30, 2012
Sold by
Estate Of James H Furr Iii
Bought by
Furr Elaine F
Create a Home Valuation Report for This Property
The Home Valuation Report is an in-depth analysis detailing your home's value as well as a comparison with similar homes in the area
Home Values in the Area
Average Home Value in this Area
Purchase History
| Date | Buyer | Sale Price | Title Company |
|---|---|---|---|
| Jones Cleon Brian | $190,000 | None Available | |
| Dixon Kelly P | $150,217 | -- | |
| Oakmont Home Builders Inc | $45,000 | -- | |
| Furr Elaine F | -- | -- |
Source: Public Records
Mortgage History
| Date | Status | Borrower | Loan Amount |
|---|---|---|---|
| Open | Jones Cleon Brian | $186,558 | |
| Previous Owner | Dixon Kelly P | $147,495 |
Source: Public Records
Tax History Compared to Growth
Tax History
| Year | Tax Paid | Tax Assessment Tax Assessment Total Assessment is a certain percentage of the fair market value that is determined by local assessors to be the total taxable value of land and additions on the property. | Land | Improvement |
|---|---|---|---|---|
| 2024 | $1,622 | $7,392 | $880 | $6,512 |
| 2023 | $1,626 | $7,392 | $880 | $6,512 |
| 2022 | $1,637 | $7,391 | $880 | $6,511 |
| 2021 | -- | $7,391 | $880 | $6,511 |
| 2020 | $1,641 | $7,391 | $0 | $0 |
| 2019 | $4,545 | $10,710 | $0 | $0 |
| 2018 | $1,281 | $5,600 | $0 | $0 |
| 2017 | $1,234 | $5,600 | $0 | $0 |
| 2016 | $1,222 | $5,600 | $0 | $0 |
| 2014 | $524 | $5,600 | $880 | $4,720 |
| 2013 | $524 | $800 | $800 | $0 |
Source: Public Records
Map
Nearby Homes
- 1233 Pinewood Rd
- 1447 Sullivan St
- 1066 Tremont Ave
- 1343 Christopher Cir
- 1033 Christopher Cir Unit 15
- 1277 Christopher Cir
- 411 Mint St
- 484 Willowspring Ln Unit B
- 484 Willowspring Ln Unit A
- 348 Catherine St
- 350 Catherine St
- 434 Stoneycreek Ln
- 366 Catherine St
- 1032 Barrow Ct
- 462 Kimbrell St Unit 5
- 369 S Workman St
- 210 Marshall St
- 234 Marshall St
- 215 Keels Ave
- 304 N Jones Ave
- 1290 Sullivan St
- 1280 Sullivan St
- 1310 Sullivan St
- 1270 Sullivan St
- 483 Belleview Rd
- 1262 Sullivan St
- 1258 E White St
- 1238 E White St
- 1238 E White St
- 1254 Sullivan St
- 1246 Sullivan St
- 1228 E White St
- 1222 White St E
- 1269 E Main St
- 1216 E White St
- 510 Belleview Rd
- 1373 E Main St
- 1238 Sullivan St
- 1374 Sullivan St
- 1382 Sullivan St