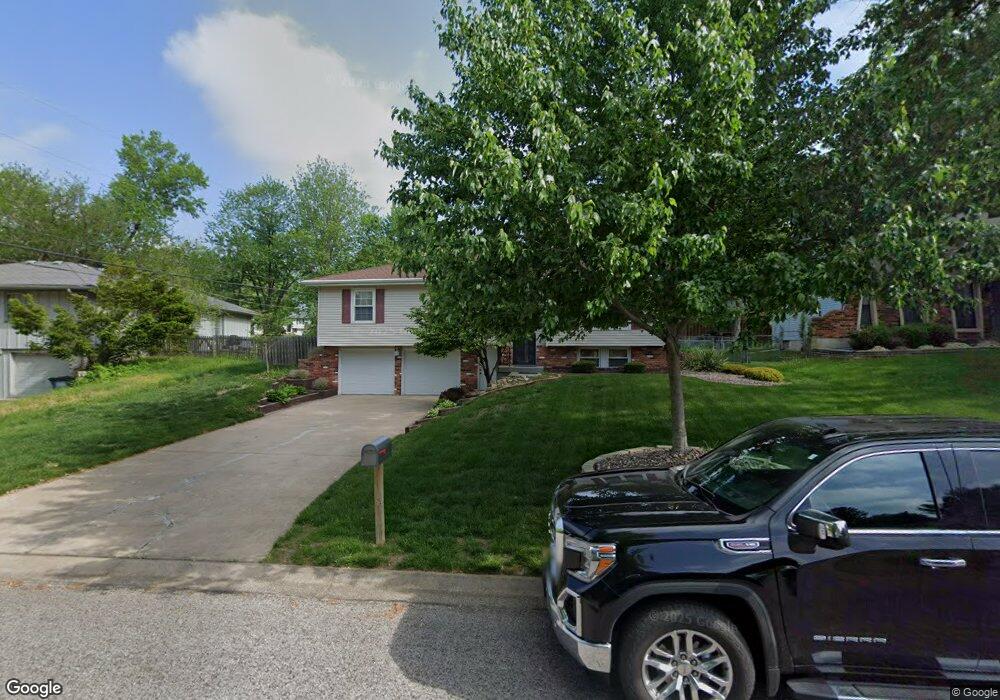
12900 W 99th Terrace Lenexa, KS 66215
Oak Park NeighborhoodEstimated Value: $328,807 - $368,000
3
Beds
2
Baths
1,230
Sq Ft
$284/Sq Ft
Est. Value
About This Home
This home is located at 12900 W 99th Terrace, Lenexa, KS 66215 and is currently estimated at $348,952, approximately $283 per square foot. 12900 W 99th Terrace is a home located in Johnson County with nearby schools including Rosehill Elementary School, Indian Woods Middle School, and Shawnee Mission South High School.
Create a Home Valuation Report for This Property
The Home Valuation Report is an in-depth analysis detailing your home's value as well as a comparison with similar homes in the area
Home Values in the Area
Average Home Value in this Area
Tax History Compared to Growth
Tax History
| Year | Tax Paid | Tax Assessment Tax Assessment Total Assessment is a certain percentage of the fair market value that is determined by local assessors to be the total taxable value of land and additions on the property. | Land | Improvement |
|---|---|---|---|---|
| 2024 | $4,025 | $36,489 | $7,792 | $28,697 |
| 2023 | $3,918 | $34,788 | $7,420 | $27,368 |
| 2022 | $3,322 | $29,451 | $6,748 | $22,703 |
| 2021 | $3,111 | $26,060 | $6,130 | $19,930 |
| 2020 | $3,075 | $25,507 | $5,575 | $19,932 |
| 2019 | $2,772 | $22,942 | $4,648 | $18,294 |
| 2018 | $2,762 | $22,655 | $4,648 | $18,007 |
| 2017 | $2,564 | $20,355 | $4,222 | $16,133 |
| 2016 | $2,420 | $18,952 | $3,865 | $15,087 |
| 2015 | $2,299 | $18,112 | $3,865 | $14,247 |
| 2013 | -- | $18,216 | $3,865 | $14,351 |
Source: Public Records
Map
Nearby Homes
- 9948 Rosehill Rd
- 13013 W 101st St
- 13300 W 102nd St
- 10184 Haskins St
- 10211 Hauser St
- 10220 Gillette St
- 10226 Gillette St
- 12207 W 101st Terrace
- 12022 W 100th St
- 10107 Monrovia St
- 10308 Westgate St
- 10331 Westgate St
- 10223 Monrovia St
- 10474 Caenen Lake Rd
- 11807 W 99th Place
- 11722 W 101 Terrace
- 12100 W 103rd Terrace
- 12894 W 93rd St
- 13401 W 105th Terrace
- 10311 Garnett St
- 12818 W 99th Terrace
- 9923 Parkhill St
- 12901 W 99th St
- 12901 W 99th St
- 12812 W 99th Terrace
- 12911 W 99th St
- 12901 W 99th Terrace
- 9929 Parkhill St
- 12817 W 99th Terrace
- 12823 W 99th St
- 12806 W 99th Terrace
- 12811 W 99th Terrace
- 9916 Parkhill St
- 9908 Parkhill St
- 12815 W 99th St
- 9924 Parkhill St
- 9935 Parkhill St
- 9900 Parkhill St
- 12812 W 100th St
- 12724 W 99th Terrace