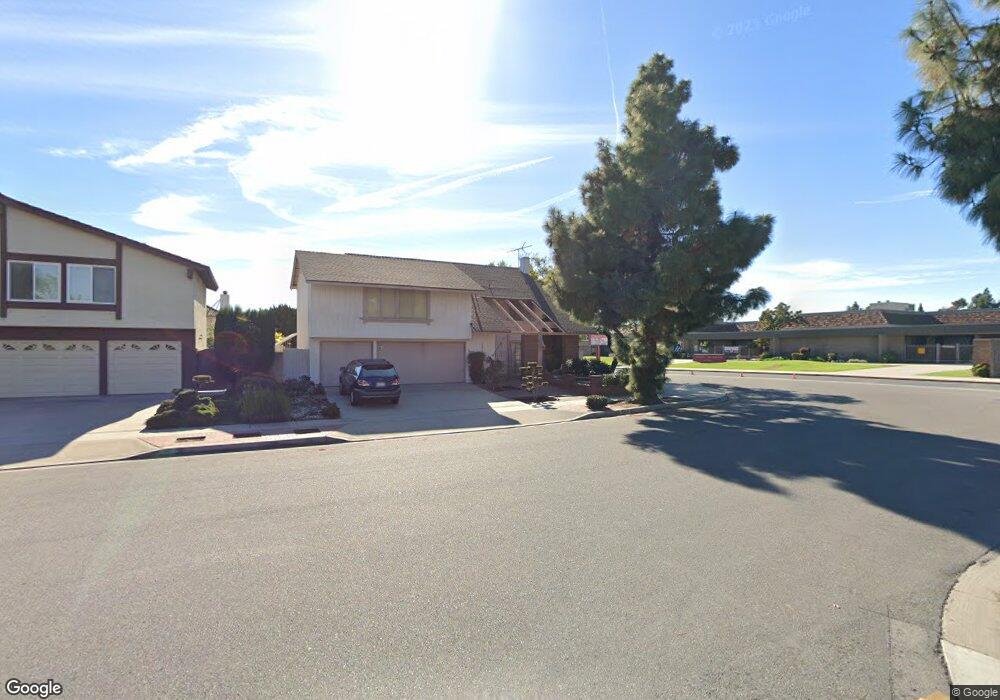
12904 Oak Crest St Cerritos, CA 90703
Estimated Value: $1,329,000 - $1,455,000
4
Beds
3
Baths
2,649
Sq Ft
$521/Sq Ft
Est. Value
About This Home
This home is located at 12904 Oak Crest St, Cerritos, CA 90703 and is currently estimated at $1,379,478, approximately $520 per square foot. 12904 Oak Crest St is a home located in Los Angeles County with nearby schools including Wittmann (Helen) Elementary School, Carmenita Middle School, and Gahr High School.
Ownership History
Date
Name
Owned For
Owner Type
Purchase Details
Closed on
Jun 11, 2024
Sold by
Solomon Richard A and Solomon Sue Ellen
Bought by
Maynard Jocelyn and Maynard Brian D
Current Estimated Value
Home Financials for this Owner
Home Financials are based on the most recent Mortgage that was taken out on this home.
Original Mortgage
$1,004,000
Outstanding Balance
$990,510
Interest Rate
6.75%
Mortgage Type
New Conventional
Estimated Equity
$388,968
Purchase Details
Closed on
Mar 2, 2013
Sold by
Solomon Richard A and Solomon Sue Ellen
Bought by
Solomon Richard A and Solomon Sue Ellen
Home Financials for this Owner
Home Financials are based on the most recent Mortgage that was taken out on this home.
Original Mortgage
$412,000
Interest Rate
2.5%
Mortgage Type
New Conventional
Purchase Details
Closed on
Oct 25, 2005
Sold by
Solomon Richard A and Solomon Sue Ellen
Bought by
Solomon Richard A and Solomon Sue Ellen
Create a Home Valuation Report for This Property
The Home Valuation Report is an in-depth analysis detailing your home's value as well as a comparison with similar homes in the area
Home Values in the Area
Average Home Value in this Area
Purchase History
| Date | Buyer | Sale Price | Title Company |
|---|---|---|---|
| Maynard Jocelyn | $1,255,000 | Wfg National Title | |
| Solomon Richard A | -- | Placer Title Company | |
| Solomon Richard A | -- | -- |
Source: Public Records
Mortgage History
| Date | Status | Borrower | Loan Amount |
|---|---|---|---|
| Open | Maynard Jocelyn | $1,004,000 | |
| Previous Owner | Solomon Richard A | $412,000 |
Source: Public Records
Tax History Compared to Growth
Tax History
| Year | Tax Paid | Tax Assessment Tax Assessment Total Assessment is a certain percentage of the fair market value that is determined by local assessors to be the total taxable value of land and additions on the property. | Land | Improvement |
|---|---|---|---|---|
| 2025 | $9,071 | $1,280,100 | $960,228 | $319,872 |
| 2024 | $9,071 | $748,520 | $418,993 | $329,527 |
| 2023 | $8,773 | $733,844 | $410,778 | $323,066 |
| 2022 | $8,639 | $719,456 | $402,724 | $316,732 |
| 2021 | $8,429 | $705,350 | $394,828 | $310,522 |
| 2019 | $8,233 | $684,430 | $383,118 | $301,312 |
| 2018 | $7,621 | $671,010 | $375,606 | $295,404 |
| 2016 | $7,308 | $644,956 | $361,022 | $283,934 |
| 2015 | $7,213 | $635,270 | $355,600 | $279,670 |
| 2014 | $7,063 | $622,827 | $348,635 | $274,192 |
Source: Public Records
Map
Nearby Homes
- 13010 Artesia Blvd
- 16429 Westbrook Ln
- 16611 Shenandoah Ave
- 16308 Indian Creek Rd
- 13370 Holly Oak Cir
- 12512 Sandycreek Ln
- 12567 Semora St
- 12525 Semora St
- 18006 Point Conception Place
- 16329 Cherry Fall Ln
- 17103 Cortner Ave
- 13210 Sutton St
- 16118 Rockyriver Ln
- 13548 Village Dr Unit A
- 13044 Hedda Ln
- 12161 Napoli Dr
- 15312 Roper Ave
- 15712 Madris Ave
- 16011 Sugarpine Ln
- 12356 Reva St
- 12910 Oak Crest St
- 12905 Lucas Ln
- 12911 Lucas Ln
- 12916 Oak Crest St
- 16819 Jeanette Ave
- 12917 Lucas Ln
- 12922 Oak Crest St
- 16818 Jeanette Ave
- 12921 Lucas Ln
- 16813 Jeanette Ave
- 16920 Yvette Ave
- 16921 Jeanette Ave
- 12927 Lucas Ln
- 12928 Oak Crest St
- 16810 Jeanette Ave
- 16821 Maurice Ct
- 16926 Yvette Ave
- 12874 Cuesta St
- 12868 Cuesta St
- 16927 Jeanette Ave