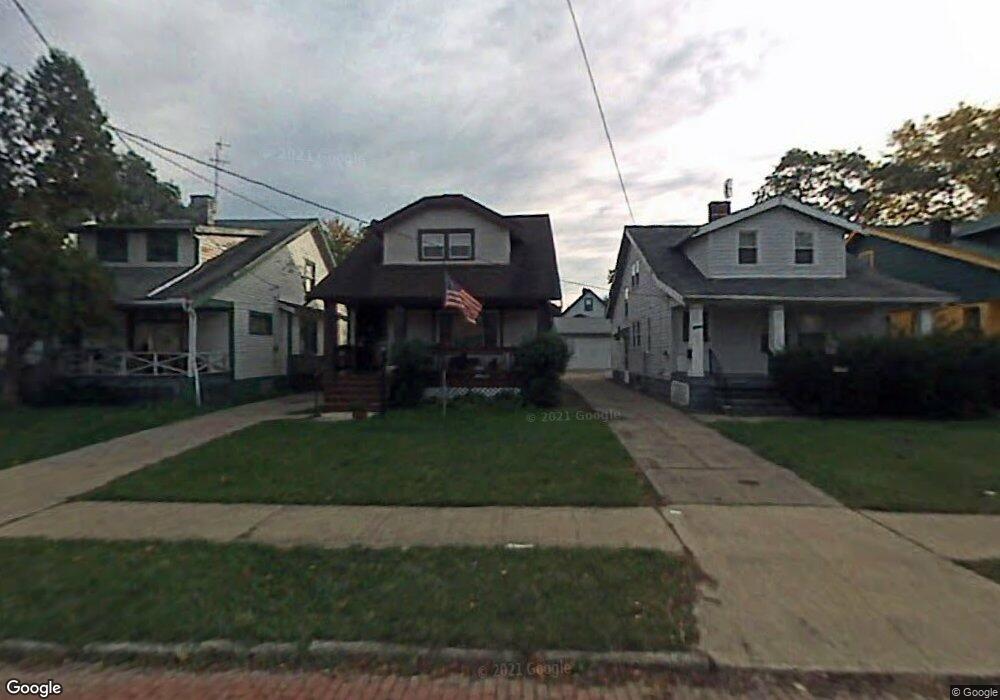
12904 Watterson Ave Cleveland, OH 44105
Corlett NeighborhoodEstimated Value: $78,000 - $91,000
3
Beds
1
Bath
1,470
Sq Ft
$58/Sq Ft
Est. Value
About This Home
This home is located at 12904 Watterson Ave, Cleveland, OH 44105 and is currently estimated at $84,763, approximately $57 per square foot. 12904 Watterson Ave is a home located in Cuyahoga County with nearby schools including Andrew J. Rickoff School, Adlai Stevenson School, and Anton Grdina School.
Ownership History
Date
Name
Owned For
Owner Type
Purchase Details
Closed on
Apr 17, 2019
Sold by
Mountainside Realty Ventures Llc
Bought by
Marshman James E and Peterson Sheila D
Current Estimated Value
Purchase Details
Closed on
Dec 15, 2018
Sold by
Marshman James E and Woods Cove Ii Llc
Bought by
Mountainside Realty Ventures Llc
Purchase Details
Closed on
Feb 26, 1993
Sold by
Dillions Ernestine
Bought by
Marshman James E
Purchase Details
Closed on
Nov 17, 1983
Sold by
Banks Marceleigh J
Bought by
Dillions Ernestine
Purchase Details
Closed on
Nov 4, 1983
Sold by
Banks Marceleigh J
Bought by
Banks Marceleigh J
Purchase Details
Closed on
Jan 18, 1977
Sold by
Hanket Lillian
Bought by
Banks Marceleigh J
Purchase Details
Closed on
Jul 14, 1975
Sold by
Vorechovsky Frank
Bought by
Hanket Lillian
Purchase Details
Closed on
Jan 1, 1975
Bought by
Vorechovsky Frank
Create a Home Valuation Report for This Property
The Home Valuation Report is an in-depth analysis detailing your home's value as well as a comparison with similar homes in the area
Home Values in the Area
Average Home Value in this Area
Purchase History
| Date | Buyer | Sale Price | Title Company |
|---|---|---|---|
| Marshman James E | $32,100 | None Available | |
| Mountainside Realty Ventures Llc | -- | None Available | |
| Marshman James E | $39,000 | -- | |
| Dillions Ernestine | -- | -- | |
| Banks Marceleigh J | -- | -- | |
| Banks Marceleigh J | $15,500 | -- | |
| Hanket Lillian | -- | -- | |
| Vorechovsky Frank | -- | -- |
Source: Public Records
Tax History Compared to Growth
Tax History
| Year | Tax Paid | Tax Assessment Tax Assessment Total Assessment is a certain percentage of the fair market value that is determined by local assessors to be the total taxable value of land and additions on the property. | Land | Improvement |
|---|---|---|---|---|
| 2024 | $1,746 | $26,110 | $4,095 | $22,015 |
| 2023 | $1,012 | $13,060 | $2,730 | $10,330 |
| 2022 | $1,007 | $13,055 | $2,730 | $10,325 |
| 2021 | $997 | $13,060 | $2,730 | $10,330 |
| 2020 | $993 | $11,240 | $2,350 | $8,890 |
| 2019 | $199 | $32,100 | $6,700 | $25,400 |
| 2018 | $263 | $11,240 | $2,350 | $8,890 |
| 2017 | $330 | $12,750 | $2,000 | $10,750 |
| 2016 | $327 | $12,750 | $2,000 | $10,750 |
| 2015 | $803 | $12,750 | $2,000 | $10,750 |
| 2014 | $803 | $14,990 | $2,350 | $12,640 |
Source: Public Records
Map
Nearby Homes
- 12925 Watterson Ave
- 12810 Benwood Ave
- 13302 Durkee Ave
- 13207 Crennell Ave
- 12700 Lenacrave Ave
- 13300 Benwood Ave
- 12506 Dove Ave
- 13001 Ferris Ave
- 12604 Angelus Ave
- 12309 Watterson Ave
- 13409 Glendale Ave
- 12822 Ferris Ave
- 13205 Southview Ave
- 12613 Revere Ave
- 3995 E 121st St
- 13217 Marston Ave
- 3950 E 121st St
- 13505 Southview Ave
- 12503 Marston Ave
- 13801 Edgewood Ave
- 12900 Watterson Ave
- 12908 Watterson Ave
- 12812 Watterson Ave
- 12912 Watterson Ave
- 12808 Watterson Ave
- 12918 Watterson Ave
- 12815 Benwood Ave
- 12813 Benwood Ave
- 12811 Benwood Ave
- 12728 Watterson Ave
- 12922 Watterson Ave
- 12731 Benwood Ave
- 12901 Benwood Ave
- 12720 Watterson Ave
- 12905 Watterson Ave
- 12901 Watterson Ave
- 13000 Watterson Ave
- 12727 Benwood Ave
- 12909 Watterson Ave
- 12815 Watterson Ave