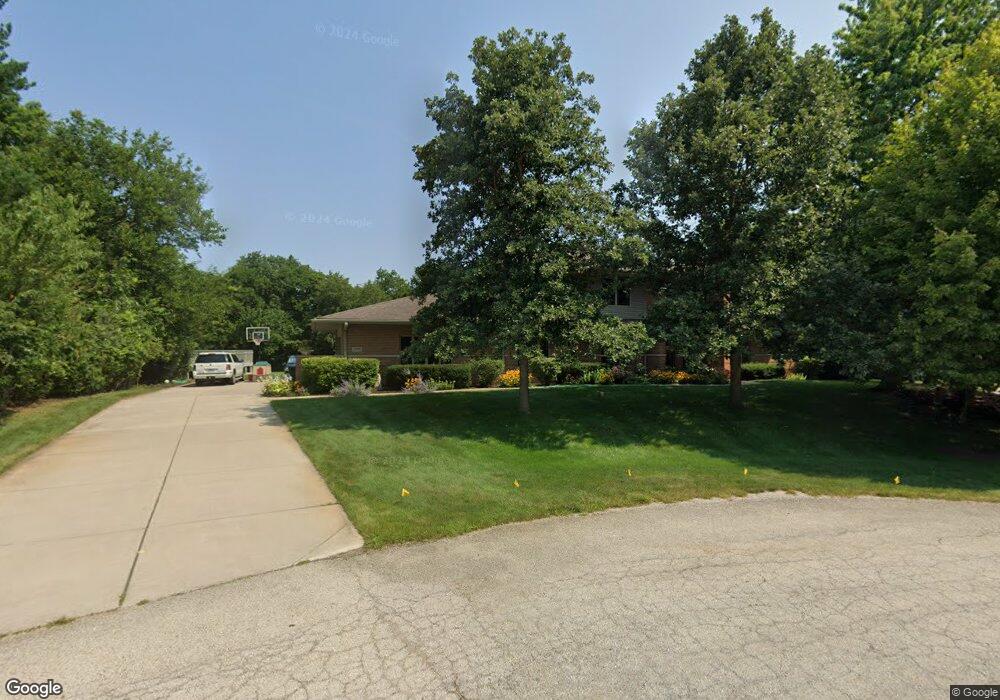
12906 W Hunt Club Ct Mokena, IL 60448
South Homer Glen NeighborhoodEstimated Value: $712,963 - $990,000
--
Bed
--
Bath
3,557
Sq Ft
$236/Sq Ft
Est. Value
About This Home
This home is located at 12906 W Hunt Club Ct, Mokena, IL 60448 and is currently estimated at $839,654, approximately $236 per square foot. 12906 W Hunt Club Ct is a home located in Will County with nearby schools including William E Young School, Hadley Middle School, and Homer Jr High School.
Ownership History
Date
Name
Owned For
Owner Type
Purchase Details
Closed on
Jul 27, 2023
Sold by
Yelnick-Pickett Yvonne
Bought by
Yvonne J Yelnick-Pickett Revocable Living Tru and Yelnick-Pickett
Current Estimated Value
Purchase Details
Closed on
Oct 1, 2003
Sold by
Yelnick Pickett Yvonne and Pickett Steve J
Bought by
Yelnick Pickett Yvonne
Home Financials for this Owner
Home Financials are based on the most recent Mortgage that was taken out on this home.
Original Mortgage
$195,000
Interest Rate
6.04%
Mortgage Type
New Conventional
Purchase Details
Closed on
Sep 23, 2003
Sold by
Yelnick Pickett Yvonne
Bought by
Pickett Steve and Yelnick Pickett Yvonne
Home Financials for this Owner
Home Financials are based on the most recent Mortgage that was taken out on this home.
Original Mortgage
$195,000
Interest Rate
6.04%
Mortgage Type
New Conventional
Purchase Details
Closed on
Apr 24, 2000
Sold by
Hinsbrook Bank & Trust Of Willowbrook
Bought by
Yelnick Pickett Yvonne
Create a Home Valuation Report for This Property
The Home Valuation Report is an in-depth analysis detailing your home's value as well as a comparison with similar homes in the area
Home Values in the Area
Average Home Value in this Area
Purchase History
| Date | Buyer | Sale Price | Title Company |
|---|---|---|---|
| Yvonne J Yelnick-Pickett Revocable Living Tru | -- | Fidelity National Title | |
| Yelnick Pickett Yvonne | -- | -- | |
| Pickett Steve | -- | -- | |
| Yelnick Pickett Yvonne | $73,000 | Chicago Title Insurance Co |
Source: Public Records
Mortgage History
| Date | Status | Borrower | Loan Amount |
|---|---|---|---|
| Previous Owner | Pickett Steve | $195,000 |
Source: Public Records
Tax History Compared to Growth
Tax History
| Year | Tax Paid | Tax Assessment Tax Assessment Total Assessment is a certain percentage of the fair market value that is determined by local assessors to be the total taxable value of land and additions on the property. | Land | Improvement |
|---|---|---|---|---|
| 2024 | $17,476 | $241,561 | $40,124 | $201,437 |
| 2023 | $17,476 | $218,964 | $36,371 | $182,593 |
| 2022 | $16,082 | $204,448 | $33,960 | $170,488 |
| 2021 | $15,315 | $193,697 | $32,174 | $161,523 |
| 2020 | $15,314 | $186,570 | $30,990 | $155,580 |
| 2019 | $14,589 | $179,480 | $29,812 | $149,668 |
| 2018 | $14,647 | $174,099 | $29,470 | $144,629 |
| 2017 | $14,373 | $169,225 | $28,645 | $140,580 |
| 2016 | $14,050 | $163,582 | $27,690 | $135,892 |
| 2015 | $13,634 | $157,442 | $26,651 | $130,791 |
| 2014 | $13,634 | $154,188 | $26,100 | $128,088 |
| 2013 | $13,634 | $154,188 | $26,100 | $128,088 |
Source: Public Records
Map
Nearby Homes
- 17860 S Crystal Lake Dr
- 0 S Parker Rd
- 13429 W Glen Entrance Dr
- 18345 S Pineprairie Dr
- 18425 S Pineprairie Dr
- 18400 S Parker Rd
- 18409 Haas Rd
- Lot 5 Oak Meadow Ct. Oakmeadow Ct
- 13242 W Chicago Bloomington Trail
- 12415 W Bruce Rd
- Will Cook Rd.+ Southwest Hwy
- 12243 179th St
- 18633 Main St
- 18801 Ruth Dr
- 0 S Meader Rd
- 12130 179th St
- 13741 Elizabeth Ln
- 13621 W Maple Rd
- 18909 Ruth Dr
- 13420 Florence Rd
- 12902 W Hunt Club Ct
- 12912 W Hunt Club Ct
- 12918 W Hunt Club Ct
- 12921 W Hunt Club Ct
- 13051 W Crystal Lake Ct
- 17843 S Crystal Lake Dr
- 17859 S Crystal Lake Dr
- 12924 W Hunt Club Ct
- 17931 S Crystal Lake Dr
- 13101 Crystal Lake Ct
- 12853 W Timber Ln
- 17937 S Crystal Lake Dr
- 17900 Crystal Lake Dr
- 17931 Crystal Lake Dr
- 17937 Crystal Lake Dr
- 17960 S Crystal Lake Dr
- 17912 S Crystal Lake Dr
- 17918 S Crystal Lake Dr
- 17943 S Crystal Lake Dr
- 12850 W Timber Ln