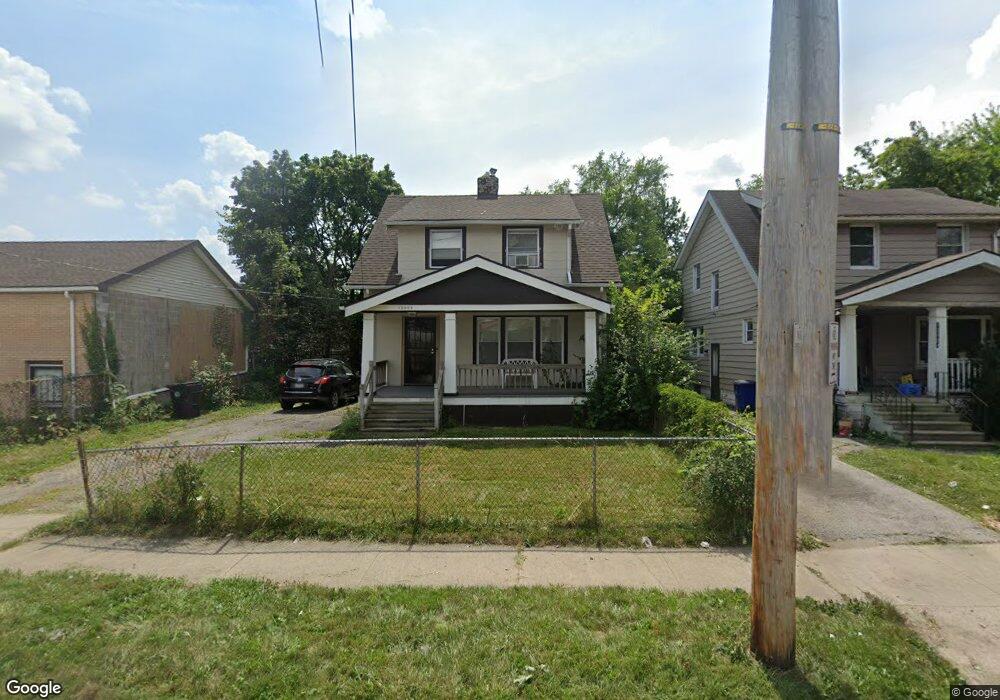
12908 Benwood Ave Cleveland, OH 44105
Corlett NeighborhoodEstimated Value: $66,000 - $86,000
3
Beds
1
Bath
1,292
Sq Ft
$57/Sq Ft
Est. Value
About This Home
This home is located at 12908 Benwood Ave, Cleveland, OH 44105 and is currently estimated at $73,653, approximately $57 per square foot. 12908 Benwood Ave is a home located in Cuyahoga County with nearby schools including Andrew J. Rickoff School, Adlai Stevenson School, and Anton Grdina School.
Ownership History
Date
Name
Owned For
Owner Type
Purchase Details
Closed on
Feb 1, 2024
Sold by
Suburban Acres Dev Group Llc
Bought by
Hall Darnell
Current Estimated Value
Purchase Details
Closed on
Oct 6, 2017
Sold by
Hall Darnell
Bought by
Subarban Aeres Development Group Llc
Purchase Details
Closed on
Mar 10, 2016
Sold by
Stingley Kenneth E
Bought by
Hall Darnell
Purchase Details
Closed on
Jul 18, 2012
Sold by
Dorteh Ernest L
Bought by
Stingley Kenneth E
Purchase Details
Closed on
May 6, 2011
Sold by
Threat Thomas O and Hawkins Carolyn L
Bought by
Dortch Ii Ernest Lee
Purchase Details
Closed on
Mar 8, 2011
Sold by
Estate Of Sarah M Threat
Bought by
Threat Thomas O and Hawkins Carolyn L
Purchase Details
Closed on
Jan 1, 1975
Bought by
Threat John O and Threat Sarah M
Create a Home Valuation Report for This Property
The Home Valuation Report is an in-depth analysis detailing your home's value as well as a comparison with similar homes in the area
Home Values in the Area
Average Home Value in this Area
Purchase History
| Date | Buyer | Sale Price | Title Company |
|---|---|---|---|
| Hall Darnell | -- | None Listed On Document | |
| Subarban Aeres Development Group Llc | -- | None Available | |
| Hall Darnell | $16,400 | None Available | |
| Stingley Kenneth E | $47,700 | None Available | |
| Dortch Ii Ernest Lee | -- | None Available | |
| Threat Thomas O | -- | None Available | |
| Threat John O | -- | -- |
Source: Public Records
Tax History Compared to Growth
Tax History
| Year | Tax Paid | Tax Assessment Tax Assessment Total Assessment is a certain percentage of the fair market value that is determined by local assessors to be the total taxable value of land and additions on the property. | Land | Improvement |
|---|---|---|---|---|
| 2024 | $986 | $14,735 | $4,865 | $9,870 |
| 2023 | $383 | $4,940 | $3,220 | $1,720 |
| 2022 | $381 | $4,935 | $3,220 | $1,715 |
| 2021 | $377 | $4,940 | $3,220 | $1,720 |
| 2020 | $375 | $4,240 | $2,770 | $1,470 |
| 2019 | $347 | $12,100 | $7,900 | $4,200 |
| 2018 | $173 | $4,240 | $2,770 | $1,470 |
| 2017 | $1,382 | $5,750 | $2,350 | $3,400 |
| 2016 | $482 | $5,750 | $2,350 | $3,400 |
| 2015 | $5,972 | $5,750 | $2,350 | $3,400 |
| 2014 | $4,657 | $7,880 | $2,770 | $5,110 |
Source: Public Records
Map
Nearby Homes
- 12810 Benwood Ave
- 13207 Crennell Ave
- 12925 Watterson Ave
- 13001 Ferris Ave
- 13300 Benwood Ave
- 12822 Ferris Ave
- 13302 Durkee Ave
- 12506 Dove Ave
- 12700 Lenacrave Ave
- 13217 Marston Ave
- 12309 Watterson Ave
- 12503 Marston Ave
- 13409 Glendale Ave
- 3995 E 121st St
- 12604 Angelus Ave
- 3950 E 121st St
- 13205 Southview Ave
- 3951 E 120th St
- 13801 Edgewood Ave
- 4526 E 131st St
- 12904 Benwood Ave
- 3978 E 131st St
- 12818 Benwood Ave
- 13019 Crennell Ave
- 3994 E 131st St
- 3974 E 131st St
- 13015 Crennell Ave
- 13011 Crennell Ave
- 12814 Benwood Ave
- 12909 Benwood Ave
- 12913 Crennell Ave
- 12905 Benwood Ave
- 3960 E 131st St
- 12901 Benwood Ave
- 12806 Benwood Ave
- 12905 Crennell Ave
- 3954 E 131st St
- 12815 Benwood Ave
- 12813 Benwood Ave
- 12901 Crennell Ave