NOT LISTED FOR SALE

1291 Lloyd Nelms Rd Nicholson, GA 30565

Estimated Value: $335,000 - $811,056

-- Bed
1 Bath
1,904 Sq Ft
$335/Sq Ft Est. Value

Last Sold January 29, 2016

Last sale price $370,000 $194 Per Sq Ft

Est. 73% increase in value since last sale

Current estimated payment $3,588/month

About This Home

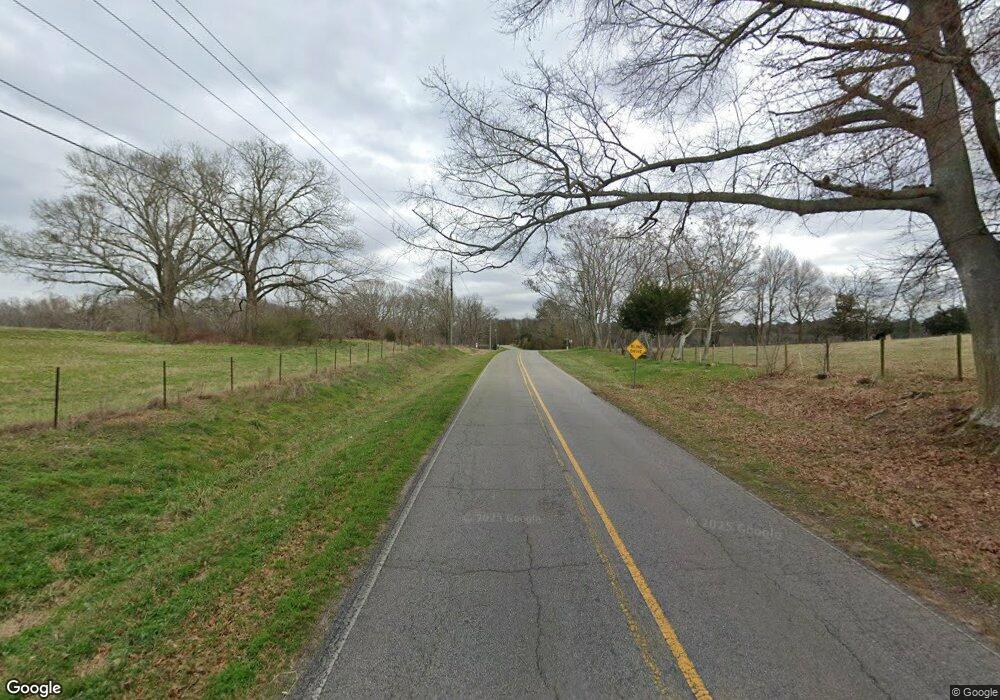
nice 57.1 acre farm only minutes from Athens in Madison County. This farm has a 4 bedroom 2.5 bath brick home. The land is fenced completely around the property. There is a 25 X 45 foot shop with both 110 & 220 electric and water. There is a mobile home rental and barn on the property. There is a creek on the property.

Ownership History

Date Name Owned For Owner Type

Purchase Details

Listed on
Jun 12, 2015
Closed on
Jan 29, 2016
Sold by
Smith Leo L
Bought by
Hart Darrell C and Hart Heather A
Seller's Agent
Stanley Thomas
Coldwell Banker Upchurch Realty
Buyer's Agent
Kim Howington
Howington Realty Company
List Price
$389,900
Sold Price
$370,000
Premium/Discount to List
-$19,900
-5.1%
Current Estimated Value
$638,685

Home Financials for this Owner

Home Financials are based on the most recent Mortgage that was taken out on this home.
Estimated Appreciation
$268,685
Avg. Annual Appreciation
5.73%

Purchase Details

Closed on
Mar 26, 1974
Sold by
Harper Gerald F
Bought by
Smith Leo L and Smith Joyce L

Purchase Details

Closed on
Oct 11, 1971
Sold by
Mccann William J
Bought by
Harper Geral F
Source: Public Records

Range of Values:

Collateral Analytics

Collateral Analytics Collateral Analytics AVMs (Automated Valuation Model) employ a number of statistical approaches combined with neighborhood-specific comparable selection guarantees the most up-to-date and precise valuations.

Not Available

Collateral Analytics does not have data for the current month. Please view the chart for historical values.

ICE

ICE Mortgage Technology ICE Mortgage Technology’s AVM (Automated Valuation Model) is a state-of-the-art online residential property valuation tool that provides a quick and accurate estimate of the value of almost any home in the U.S.

Not Available

ICE Mortgage Technology does not have data for the current month. Please view the chart for historical values.

First American

First American First American Data & Analytics’ next-generation AVM combines unrivaled data assets with a blended ensemble of valuation models to produce highly accurate, reliable valuations you can trust.

Not Available

First American does not have data for the current month. Please view the chart for historical values.

Quantarium

Quantarium Quantarium’s valuation service, repeatedly proven the industry’s most accurate and comprehensive, is supercharged with a self-learning and auto-tuning AI engine that continually becomes smarter and more accurate as it processes daily inputs from the industry’s leading RE data lake.

Not Available

Quantarium does not have data for the current month. Please view the chart for historical values.

Average Value
Not Available
List Price
Sold Price
Create a Home Valuation Report for This Property
The Home Valuation Report is an in-depth analysis detailing your home's value as well as a comparison with similar homes in the area

Home Values in the Area

Source: Public Records

Average Home Value in this Area


Source: Public Records

Purchase History

Date Buyer Sale Price Title Company
Hart Darrell C $3,400 --
Smith Leo L -- --
Harper Geral F -- --
Source: Public Records

Property History

Date Event Price List to Sale Price per Sq Ft Prior Sale
01/29/2016 01/29/16 Sold $370,000 -5.1% -- View Prior Sale
12/30/2015 12/30/15 Pending -- -- --
06/12/2015 06/12/15 For Sale $389,900 -- --

Tax History Compared to Growth

Source: Public Records

Tax History

Year Tax Paid Tax Assessment Tax Assessment Total Assessment is a certain percentage of the fair market value that is determined by local assessors to be the total taxable value of land and additions on the property. Land Improvement
2024 $2,646 $229,894 $152,989 $76,905
2023 $2,041 $225,231 $152,989 $72,242
2022 $2,374 $176,688 $112,325 $64,363
2021 $2,099 $134,055 $85,384 $48,671
2020 $2,088 $127,404 $78,733 $48,671
2019 $1,610 $111,705 $78,733 $32,972
2018 $1,568 $110,746 $78,733 $32,013
2017 $3,212 $111,546 $77,929 $33,617
2016 $2,772 $106,575 $77,929 $28,646
2015 $2,766 $106,363 $77,929 $28,434
2014 $1,047 $106,766 $77,929 $28,837
2013 -- $106,766 $77,929 $28,837
Source: Public Records

Agents Affiliated with this Home

  • Section Image
  • Section Image
See All Agents

Map