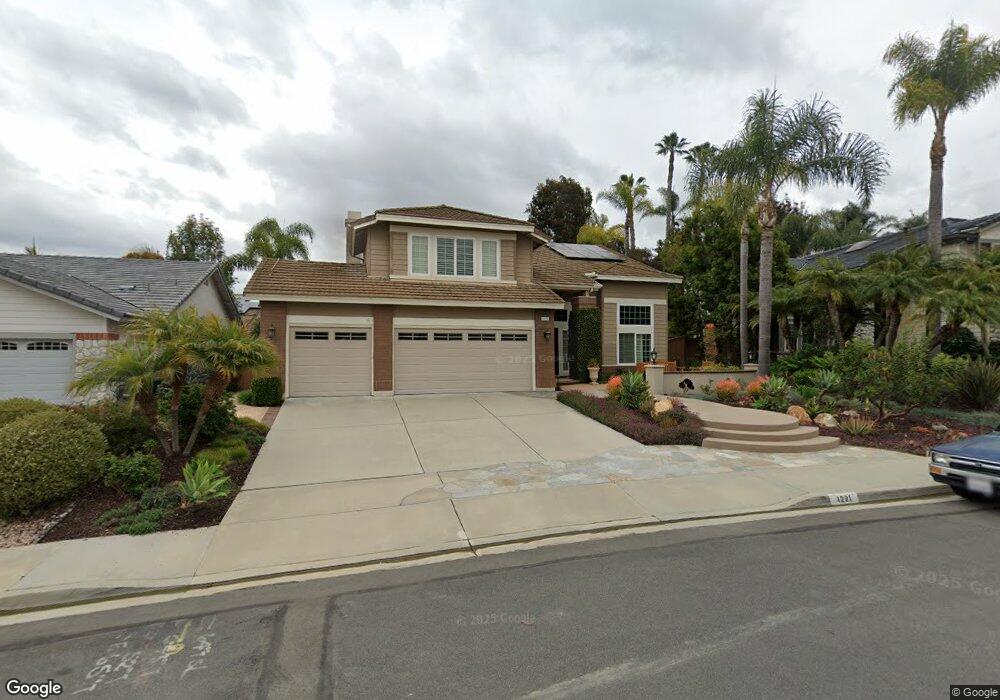
1291 Orchard Glen Cir Encinitas, CA 92024
Central Encinitas NeighborhoodEstimated Value: $1,978,041 - $2,364,000
4
Beds
3
Baths
2,826
Sq Ft
$753/Sq Ft
Est. Value
About This Home
This home is located at 1291 Orchard Glen Cir, Encinitas, CA 92024 and is currently estimated at $2,127,260, approximately $752 per square foot. 1291 Orchard Glen Cir is a home located in San Diego County with nearby schools including El Camino Creek Elementary School, Diegueno Middle School, and La Costa Canyon High School.
Ownership History
Date
Name
Owned For
Owner Type
Purchase Details
Closed on
Nov 27, 2012
Sold by
Jensen William H and Jensen Wendy Jo
Bought by
Jensen William H and Jensen Wendy Jo
Current Estimated Value
Purchase Details
Closed on
Sep 22, 1994
Sold by
Huang Tai Shou and Huang Bo Yi
Bought by
Jensen William H and Jensen Wendy Jo
Home Financials for this Owner
Home Financials are based on the most recent Mortgage that was taken out on this home.
Original Mortgage
$264,800
Interest Rate
7.87%
Purchase Details
Closed on
Jul 7, 1989
Create a Home Valuation Report for This Property
The Home Valuation Report is an in-depth analysis detailing your home's value as well as a comparison with similar homes in the area
Home Values in the Area
Average Home Value in this Area
Purchase History
| Date | Buyer | Sale Price | Title Company |
|---|---|---|---|
| Jensen William H | -- | Ticor Title | |
| Jensen William H | $331,000 | Union Land Title | |
| -- | $358,900 | -- |
Source: Public Records
Mortgage History
| Date | Status | Borrower | Loan Amount |
|---|---|---|---|
| Closed | Jensen William H | $264,800 |
Source: Public Records
Tax History Compared to Growth
Tax History
| Year | Tax Paid | Tax Assessment Tax Assessment Total Assessment is a certain percentage of the fair market value that is determined by local assessors to be the total taxable value of land and additions on the property. | Land | Improvement |
|---|---|---|---|---|
| 2025 | $6,333 | $555,955 | $166,781 | $389,174 |
| 2024 | $6,333 | $545,055 | $163,511 | $381,544 |
| 2023 | $6,139 | $534,368 | $160,305 | $374,063 |
| 2022 | $5,984 | $523,891 | $157,162 | $366,729 |
| 2021 | $5,874 | $513,620 | $154,081 | $359,539 |
| 2020 | $5,772 | $508,355 | $152,502 | $355,853 |
| 2019 | $5,658 | $498,388 | $149,512 | $348,876 |
| 2018 | $5,565 | $488,617 | $146,581 | $342,036 |
| 2017 | $5,470 | $479,037 | $143,707 | $335,330 |
| 2016 | $5,304 | $469,645 | $140,890 | $328,755 |
| 2015 | $5,203 | $462,591 | $138,774 | $323,817 |
| 2014 | $5,077 | $453,530 | $136,056 | $317,474 |
Source: Public Records
Map
Nearby Homes
- 1278 Avenida Miguel
- 2702 Jacaranda Ave
- 8008 Avenida Secreto
- 1633 Willowspring Dr N
- 1931 Avenida Joaquin
- 721 Summersong Ln
- 1848 Wandering Rd
- 1981 Avenida Joaquin
- 7941 Calle Madrid Unit 4
- 1655 Splitrail Dr
- 7925 Calle Madrid
- 1931 Hummock Ln
- 8010 Calle Pinon
- 3736 38 Via Rancho Michelle
- 658 660 Santa fe Dr
- 772 Conestoga Ct
- 1519 Valleda Ln
- 3356 Corte Tiburon
- 1709 Edgefield Ln
- 1617 Blossom Field Way
- 1285 Orchard Glen Cir
- 1297 Orchard Glen Cir
- 1857 Orchard Wood Rd
- 1281 Orchard Glen Cir
- 1863 Orchard Wood Rd
- 1288 Orchard Glen Cir
- 1810 Meadowhaven Ct
- 1294 Orchard Glen Cir
- 1266 Orchard Glen Cir
- 1820 Meadowhaven Ct
- 1869 Orchard Wood Rd
- 1848 Orchard Wood Rd
- 1277 Orchard Glen Cir
- 1842 Orchard Wood Rd
- 1854 Orchard Wood Rd
- 1836 Orchard Wood Rd
- 1819 Orchard Wood Rd
- 1805 Meadowhaven Ct
- 1860 Orchard Wood Rd
- 1258 Orchard Glen Cir