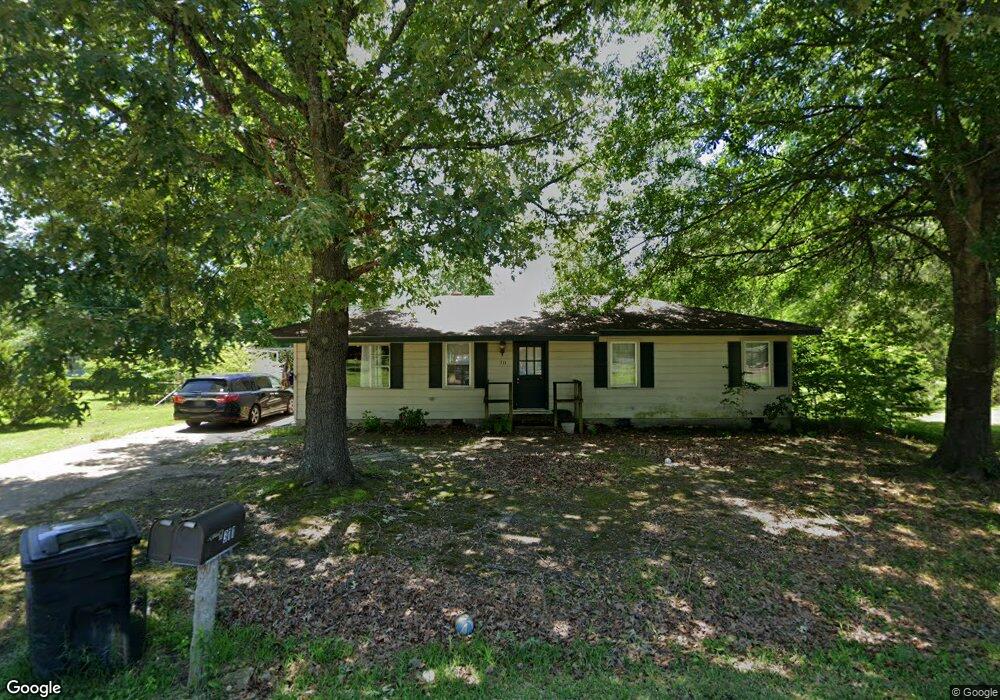
1291 Seitz St Unit SUB West Point, MS 39773
Estimated Value: $88,000 - $159,000
4
Beds
--
Bath
1,306
Sq Ft
$89/Sq Ft
Est. Value
About This Home
This home is located at 1291 Seitz St Unit SUB, West Point, MS 39773 and is currently estimated at $115,862, approximately $88 per square foot. 1291 Seitz St Unit SUB is a home located in Clay County with nearby schools including East Side Elementary School, West Clay Elementary School, and Church Hill Elementary School.
Ownership History
Date
Name
Owned For
Owner Type
Purchase Details
Closed on
Nov 20, 2020
Sold by
Parker Dennis B and Parker Nancy Rochelle
Bought by
Nimmo Shane Loren
Current Estimated Value
Home Financials for this Owner
Home Financials are based on the most recent Mortgage that was taken out on this home.
Original Mortgage
$60,505
Outstanding Balance
$53,347
Interest Rate
2.8%
Mortgage Type
Unknown
Estimated Equity
$62,515
Purchase Details
Closed on
Jan 30, 2018
Sold by
Estes Justin Brian
Bought by
Parker Dennis B and Parker Nancy Rochelle
Home Financials for this Owner
Home Financials are based on the most recent Mortgage that was taken out on this home.
Original Mortgage
$54,976
Interest Rate
3.95%
Mortgage Type
New Conventional
Purchase Details
Closed on
Oct 13, 2011
Sold by
Taylor John Frank and Taylor Mary Alice
Bought by
Estes Justin Brian
Create a Home Valuation Report for This Property
The Home Valuation Report is an in-depth analysis detailing your home's value as well as a comparison with similar homes in the area
Purchase History
| Date | Buyer | Sale Price | Title Company |
|---|---|---|---|
| Nimmo Shane Loren | -- | -- | |
| Nimmo Shane Loren | -- | None Listed On Document | |
| Parker Dennis B | -- | -- | |
| Estes Justin Brian | -- | -- |
Source: Public Records
Mortgage History
| Date | Status | Borrower | Loan Amount |
|---|---|---|---|
| Open | Nimmo Shane Loren | $60,505 | |
| Closed | Nimmo Shane Loren | $60,505 | |
| Previous Owner | Parker Dennis B | $54,976 |
Source: Public Records
Tax History
| Year | Tax Paid | Tax Assessment Tax Assessment Total Assessment is a certain percentage of the fair market value that is determined by local assessors to be the total taxable value of land and additions on the property. | Land | Improvement |
|---|---|---|---|---|
| 2025 | $214 | $9,491 | $1,500 | $7,991 |
| 2024 | $589 | $6,327 | $1,000 | $5,327 |
| 2023 | $589 | $5,418 | $1,000 | $4,418 |
| 2022 | $191 | $5,418 | $1,000 | $4,418 |
| 2021 | $188 | $5,418 | $1,000 | $4,418 |
| 2020 | $450 | $8,126 | $1,500 | $6,626 |
| 2019 | $416 | $8,065 | $1,500 | $6,565 |
| 2018 | $403 | $8,065 | $1,500 | $6,565 |
| 2017 | $399 | $8,065 | $1,500 | $6,565 |
| 2016 | $396 | $8,065 | $1,500 | $6,565 |
| 2015 | $371 | $7,390 | $1,500 | $5,890 |
| 2014 | $331 | $4,926 | $1,000 | $3,926 |
| 2013 | $331 | $4,926 | $1,000 | $3,926 |
Source: Public Records
Map
Nearby Homes
- 593 Lone Oak Park
- 222 Lone Oak Park
- 222 Wyman Dr
- 593 Lone Oak Dr
- 165 William Huffman Rd
- 171 Fagan Blvd
- 399 Lone Oak Dr
- 49 Barksdale Dr
- 7642 Highway 45 Alternate N
- 0 Mississippi 50
- 0 Us Hwy 45a Unit 4033641
- 0 Us Hwy 45a Unit 22-3720
- 20 Beverly Dr
- 0 Us-45 Alt N Lot 14
- 201 Quail Ridge Rd
- 159 Washington St
- 0 Kennedy Dr
- 0 Hwy 45 Alt N
- 229 S Division St
- 228 S Division St
- 1301 Seitz St
- 1290 Seitz St Unit SUB
- 1300 Seitz St Unit SUB
- 1321 Seitz St Unit SUB
- 1320 Seitz St Unit SUB
- 1260 Seitz St
- 1191 Seitz St
- 1201 Seitz St Unit SUB
- 386 Seitz St
- 1250 Seitz St
- 1351 Seitz St Unit SUB
- 1171 Seitz St
- 1210 Seitz St
- 1460 Lone Oak Park
- 440 Lone Oak Park
- 420 Seitz St
- 1200 Seitz St
- 202 Seitz St
- 1103 Seitz St
- 181 Seitz St
Your Personal Tour Guide
Ask me questions while you tour the home.