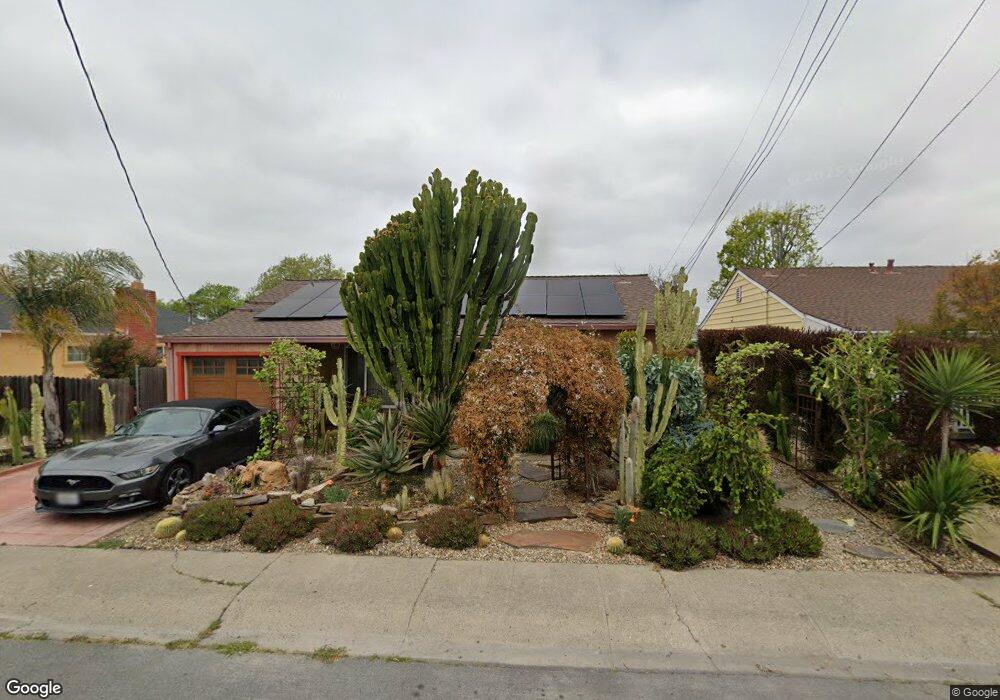
1291 Via Nube San Lorenzo, CA 94580
Estimated Value: $861,000 - $976,000
3
Beds
2
Baths
1,743
Sq Ft
$521/Sq Ft
Est. Value
About This Home
This home is located at 1291 Via Nube, San Lorenzo, CA 94580 and is currently estimated at $908,760, approximately $521 per square foot. 1291 Via Nube is a home located in Alameda County with nearby schools including Del Rey Elementary School, Bohannon Middle School, and Arroyo High School.
Ownership History
Date
Name
Owned For
Owner Type
Purchase Details
Closed on
Jan 22, 2009
Sold by
Casey Eugene L
Bought by
Casey Eugene L
Current Estimated Value
Home Financials for this Owner
Home Financials are based on the most recent Mortgage that was taken out on this home.
Original Mortgage
$260,000
Outstanding Balance
$163,990
Interest Rate
5.14%
Mortgage Type
New Conventional
Estimated Equity
$744,770
Purchase Details
Closed on
Sep 30, 2005
Sold by
Casey Eugene Leo
Bought by
Casey Eugene Leo and Casey Iii Revocable T Eugene L
Purchase Details
Closed on
Jul 20, 1999
Sold by
Casey Eugene L
Bought by
Casey Eugne Leo
Home Financials for this Owner
Home Financials are based on the most recent Mortgage that was taken out on this home.
Original Mortgage
$170,000
Interest Rate
7.51%
Mortgage Type
Seller Take Back
Create a Home Valuation Report for This Property
The Home Valuation Report is an in-depth analysis detailing your home's value as well as a comparison with similar homes in the area
Home Values in the Area
Average Home Value in this Area
Purchase History
| Date | Buyer | Sale Price | Title Company |
|---|---|---|---|
| Casey Eugene L | -- | Servicelink | |
| Casey Eugene Leo | -- | -- | |
| Casey Eugne Leo | $170,000 | Fidelity National Title Co |
Source: Public Records
Mortgage History
| Date | Status | Borrower | Loan Amount |
|---|---|---|---|
| Open | Casey Eugene L | $260,000 | |
| Closed | Casey Eugne Leo | $170,000 |
Source: Public Records
Tax History Compared to Growth
Tax History
| Year | Tax Paid | Tax Assessment Tax Assessment Total Assessment is a certain percentage of the fair market value that is determined by local assessors to be the total taxable value of land and additions on the property. | Land | Improvement |
|---|---|---|---|---|
| 2025 | $2,663 | $160,349 | $35,550 | $131,799 |
| 2024 | $2,663 | $157,068 | $34,853 | $129,215 |
| 2023 | $2,666 | $160,852 | $34,170 | $126,682 |
| 2022 | $2,609 | $150,699 | $33,500 | $124,199 |
| 2021 | $2,528 | $147,606 | $32,843 | $121,763 |
| 2020 | $2,460 | $153,022 | $32,507 | $120,515 |
| 2019 | $2,445 | $150,022 | $31,869 | $118,153 |
| 2018 | $2,252 | $147,082 | $31,245 | $115,837 |
| 2017 | $2,153 | $144,198 | $30,632 | $113,566 |
| 2016 | $2,050 | $141,371 | $30,031 | $111,340 |
| 2015 | $2,001 | $139,248 | $29,580 | $109,668 |
| 2014 | $1,971 | $136,521 | $29,001 | $107,520 |
Source: Public Records
Map
Nearby Homes
- 1086 Via Coralla
- 1088 Azalea Ct
- 17221 Via Estrella
- 1649 Via Tovita
- 18018 Sahara Rd
- 1699 Bandoni Ave
- 19150 Hesperian Blvd Unit 19
- 769 Bartlett Ave
- 1844 Via Natal
- 825 W A St Unit 1
- 16011 Via Conejo
- 823 W A St Unit 2
- 19390 Hesperian Blvd
- 821 W A St
- 19736 Royal Ave
- 1631 Via Ventana
- 0 E 14th St Unit 41059501
- 17472 Via Segundo
- 15822 Devonwood Way
- 15835 Via Seco
- 1285 Via Nube
- 17498 Via Alamitos
- 17494 Via Alamitos
- 1279 Via Nube
- 1262 Via Dolorosa
- 1254 Via Dolorosa
- 17480 Via Alamitos
- 1248 Via Dolorosa
- 1275 Via Nube
- 1292 Via Nube
- 1286 Via Nube
- 1298 Via Nube
- 1280 Via Nube
- 1311 Via Nube
- 17495 Via Alamitos
- 1269 Via Nube
- 1276 Via Nube
- 17489 Via Alamitos
- 1230 Via Dolorosa
- 1312 Via Nube