Estimated Value: $946,797 - $1,009,000
5
Beds
2
Baths
1,715
Sq Ft
$572/Sq Ft
Est. Value
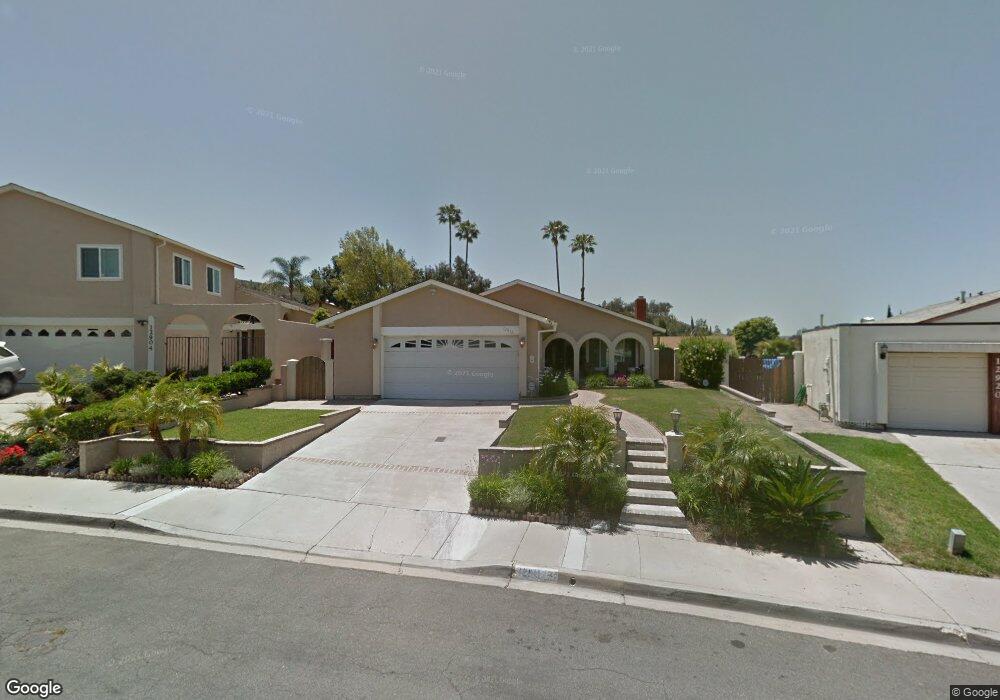
About This Home
This home is located at 12912 Grimsley Ave, Poway, CA 92064 and is currently estimated at $980,949, approximately $571 per square foot. 12912 Grimsley Ave is a home located in San Diego County with nearby schools including Garden Road Elementary, Twin Peaks Middle, and Poway High.
Ownership History
Date
Name
Owned For
Owner Type
Purchase Details
Closed on
Jun 14, 2011
Sold by
Orr Jeffery K and Orr Cathleen S
Bought by
Orr Jeffery K and Orr Cathleen S
Current Estimated Value
Home Financials for this Owner
Home Financials are based on the most recent Mortgage that was taken out on this home.
Original Mortgage
$398,859
Outstanding Balance
$269,614
Interest Rate
4.22%
Mortgage Type
FHA
Estimated Equity
$711,335
Purchase Details
Closed on
Apr 12, 2008
Sold by
Orr Jeffery K and Orr Cathleen S
Bought by
Orr Jeffery K and Orr Cathleen S
Purchase Details
Closed on
Nov 20, 1998
Sold by
Smith Tony A and Renee Pesci Smith
Bought by
Orr Jeffery K and Willhite Orr Cathleen S
Purchase Details
Closed on
May 27, 1998
Sold by
Smith Tony A
Bought by
Pesci Smith Renee
Purchase Details
Closed on
Oct 13, 1994
Sold by
Voit James M and Voit Elizabeth J
Bought by
Smith Tony A and Pesci Smith Renee
Purchase Details
Closed on
Nov 13, 1984
Create a Home Valuation Report for This Property
The Home Valuation Report is an in-depth analysis detailing your home's value as well as a comparison with similar homes in the area
Home Values in the Area
Average Home Value in this Area
Purchase History
| Date | Buyer | Sale Price | Title Company |
|---|---|---|---|
| Orr Jeffery K | -- | Lsi | |
| Orr Jeffery K | -- | Lsi | |
| Orr Jeffery K | -- | None Available | |
| Orr Jeffery K | $213,500 | California Title Company | |
| Pesci Smith Renee | -- | -- | |
| Smith Tony A | $187,500 | Fidelity National Title | |
| -- | $90,000 | -- |
Source: Public Records
Mortgage History
| Date | Status | Borrower | Loan Amount |
|---|---|---|---|
| Open | Orr Jeffery K | $398,859 | |
| Closed | Orr Jeffery K | $398,859 |
Source: Public Records
Tax History
| Year | Tax Paid | Tax Assessment Tax Assessment Total Assessment is a certain percentage of the fair market value that is determined by local assessors to be the total taxable value of land and additions on the property. | Land | Improvement |
|---|---|---|---|---|
| 2025 | $3,700 | $334,680 | $169,571 | $165,109 |
| 2024 | $3,700 | $328,119 | $166,247 | $161,872 |
| 2023 | $3,621 | $321,687 | $162,988 | $158,699 |
| 2022 | $3,560 | $315,381 | $159,793 | $155,588 |
| 2021 | $3,513 | $309,198 | $156,660 | $152,538 |
| 2020 | $3,466 | $306,028 | $155,054 | $150,974 |
| 2019 | $3,377 | $300,028 | $152,014 | $148,014 |
| 2018 | $3,282 | $294,146 | $149,034 | $145,112 |
| 2017 | $12,733 | $288,379 | $146,112 | $142,267 |
| 2016 | $9,830 | $282,726 | $143,248 | $139,478 |
| 2015 | $3,082 | $278,480 | $141,097 | $137,383 |
| 2014 | $3,010 | $273,026 | $138,334 | $134,692 |
Source: Public Records
Map
Nearby Homes
- 13419 Sebago Ave
- 14610 Fairburn St
- 13746 Paseo Bonita
- 14550 Dehia St
- 13735 Fairgate Dr
- 14118 Ipava Dr
- 000 Carlson Ct 9 Unit 9
- 13716 Midland Rd
- 14003 Jasmine Ave Unit 193
- 14089 Pomegranate Ave Unit 214
- 13908 Hibiscus Ave Unit 40
- 13941 Wisteria Ave
- 13329 Casa Vista St Unit 98
- 13850 Midgrove Ct
- 12959 Creek Park Dr
- 13947 Midland Rd
- 15792 Via Santa Pradera
- 13220 Dana Vista St Unit 114
- 13314 Buena Vista Unit 71
- 13230 Creekside Ln
- 12904 Grimsley Ave
- 12920 Grimsley Ave
- 12941 Standish Dr
- 12947 Standish Dr
- 12850 Grimsley Ave
- 12935 Standish Dr
- 12928 Grimsley Ave
- 12953 Standish Dr
- 12929 Standish Dr
- 12913 Grimsley Ave
- 12957 Standish Dr
- 12921 Grimsley Ave
- 12842 Grimsley Ave
- 12936 Grimsley Ave
- 12851 Grimsley Ave
- 12929 Grimsley Ave
- 12923 Standish Dr
- 12843 Grimsley Ave
- 12834 Grimsley Ave
- 12937 Grimsley Ave
Your Personal Tour Guide
Ask me questions while you tour the home.