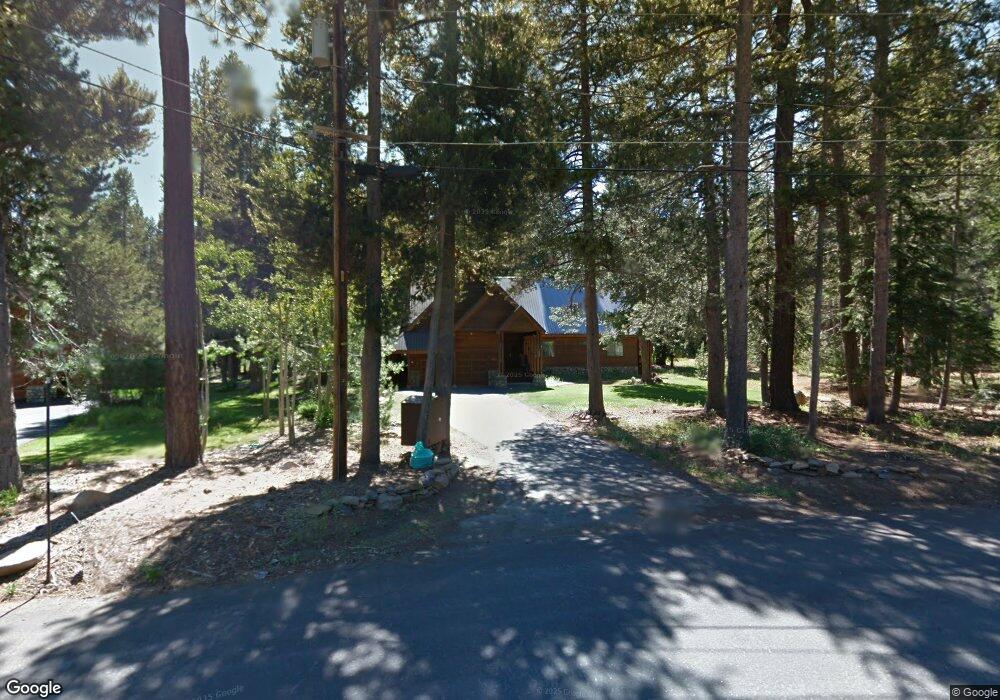
12912 Ski View Loop Truckee, CA 96161
Tahoe Donner NeighborhoodEstimated Value: $1,458,404 - $1,634,000
5
Beds
4
Baths
3,074
Sq Ft
$503/Sq Ft
Est. Value
About This Home
This home is located at 12912 Ski View Loop, Truckee, CA 96161 and is currently estimated at $1,547,101, approximately $503 per square foot. 12912 Ski View Loop is a home located in Nevada County with nearby schools including Truckee Elementary School, Alder Creek Middle School, and Tahoe Truckee High School.
Ownership History
Date
Name
Owned For
Owner Type
Purchase Details
Closed on
Nov 5, 2024
Sold by
Tonini Carlene R
Bought by
Carlene R Tonini-Boutacoff Family Trust and Tonini-Boutacoff
Current Estimated Value
Purchase Details
Closed on
Jul 19, 2000
Sold by
Boutacoff Eric Alexis
Bought by
Boutacoff Eric Alexis and Tonini Carlene R
Home Financials for this Owner
Home Financials are based on the most recent Mortgage that was taken out on this home.
Original Mortgage
$416,250
Interest Rate
8.04%
Mortgage Type
Purchase Money Mortgage
Purchase Details
Closed on
Jul 14, 2000
Sold by
Briesach Martin J and Briesach Lauralee H
Bought by
Boutacoff Eric Alexis
Home Financials for this Owner
Home Financials are based on the most recent Mortgage that was taken out on this home.
Original Mortgage
$416,250
Interest Rate
8.04%
Mortgage Type
Purchase Money Mortgage
Create a Home Valuation Report for This Property
The Home Valuation Report is an in-depth analysis detailing your home's value as well as a comparison with similar homes in the area
Home Values in the Area
Average Home Value in this Area
Purchase History
| Date | Buyer | Sale Price | Title Company |
|---|---|---|---|
| Carlene R Tonini-Boutacoff Family Trust | -- | None Listed On Document | |
| Boutacoff Eric Alexis | -- | Fidelity National Title | |
| Boutacoff Eric Alexis | -- | Fidelity National Title Co | |
| Boutacoff Eric Alexis | $555,000 | Fidelity National Title Co |
Source: Public Records
Mortgage History
| Date | Status | Borrower | Loan Amount |
|---|---|---|---|
| Previous Owner | Boutacoff Eric Alexis | $416,250 |
Source: Public Records
Tax History
| Year | Tax Paid | Tax Assessment Tax Assessment Total Assessment is a certain percentage of the fair market value that is determined by local assessors to be the total taxable value of land and additions on the property. | Land | Improvement |
|---|---|---|---|---|
| 2025 | $11,081 | $904,439 | $251,562 | $652,877 |
| 2024 | $11,081 | $886,706 | $246,630 | $640,076 |
| 2023 | $10,990 | $869,321 | $241,795 | $627,526 |
| 2022 | $10,711 | $852,276 | $237,054 | $615,222 |
| 2021 | $9,872 | $799,565 | $232,406 | $567,159 |
| 2020 | $9,811 | $791,367 | $230,023 | $561,344 |
| 2019 | $9,564 | $752,321 | $225,513 | $526,808 |
| 2018 | $8,916 | $737,571 | $221,092 | $516,479 |
| 2017 | $8,731 | $723,113 | $216,761 | $506,352 |
| 2016 | $8,661 | $708,166 | $211,742 | $496,424 |
| 2015 | $8,464 | $697,532 | $208,564 | $488,968 |
| 2014 | -- | $683,870 | $204,480 | $479,390 |
Source: Public Records
Map
Nearby Homes
- 13938 Northwoods Blvd
- 13854 Northwoods Blvd
- 14258 Glacier View Dr
- 14579 Northwoods Blvd
- 14653 Northwoods Blvd
- 11926 Rhineland Ave
- 11711 Snowpeak Way Unit 555
- 16725 Ski Slope Way Unit 5
- 13257 Ski Slope Way
- 13420 Northwoods Blvd
- 11723 Snowpeak Way Unit 567
- 13038 Ski Slope Way
- 14487 Ski Slope Way
- 11591 Snowpeak Way Unit 407
- 12465 Bear Meadows Ct Unit 3
- 13239 Northwoods Blvd Unit B
- 13205 Northwoods Blvd Unit 2
- 11566 Rhineland Ave
- 11569 Snowpeak Way Unit 651
- 12574 Saint Moritz Ln
- 12924 Ski View Loop
- 12890 Ski View Loop
- 12934 Ski View Loop
- 12903 Skiview Loop
- 12948 Ski View Loop
- 12878 Ski View Loop
- 12935 Ski View Loop
- 12935 Ski View Loop Unit 11
- 12962 Ski View Loop
- 12865 Ski View Loop
- 12949 Ski View Loop Unit 11
- 12976 Ski View Loop
- 12963 Skiview Loop
- 12837 Ski View Loop
- 12990 Ski View Loop
- 12838 Ski View Loop
- 12977 Skiview Loop
- 12823 Ski View Loop
- 13004 Ski View Loop
- 12824 Ski View Loop Unit 11
Your Personal Tour Guide
Ask me questions while you tour the home.