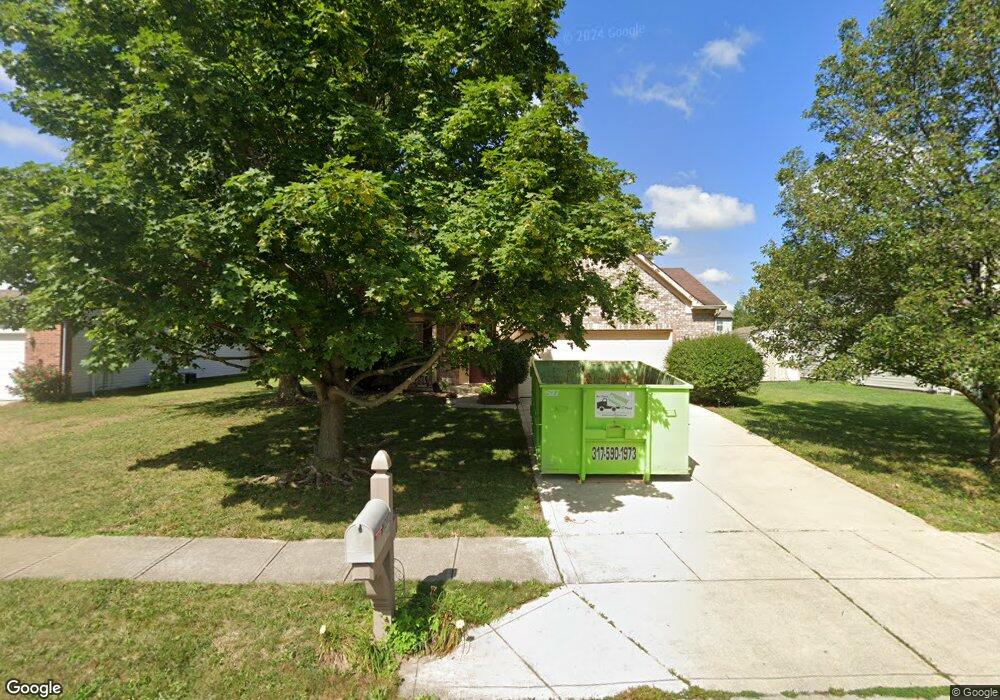
12912 Turnham Dr Fishers, IN 46038
Estimated Value: $349,838 - $360,000
4
Beds
3
Baths
1,837
Sq Ft
$194/Sq Ft
Est. Value
About This Home
This home is located at 12912 Turnham Dr, Fishers, IN 46038 and is currently estimated at $357,210, approximately $194 per square foot. 12912 Turnham Dr is a home located in Hamilton County with nearby schools including Cumberland Road Elementary School, East Middle School, and Fishers Junior High School.
Ownership History
Date
Name
Owned For
Owner Type
Purchase Details
Closed on
Sep 4, 2019
Sold by
Mathias Matthew J
Bought by
Mathias Molly K
Current Estimated Value
Home Financials for this Owner
Home Financials are based on the most recent Mortgage that was taken out on this home.
Original Mortgage
$152,750
Outstanding Balance
$134,070
Interest Rate
3.7%
Mortgage Type
New Conventional
Estimated Equity
$223,140
Purchase Details
Closed on
Mar 26, 2010
Sold by
Drake Hollis Marie and Liechty Hollis Marie
Bought by
Mathias Matthew J and Mathias Molly K
Home Financials for this Owner
Home Financials are based on the most recent Mortgage that was taken out on this home.
Original Mortgage
$152,683
Interest Rate
5.12%
Mortgage Type
FHA
Purchase Details
Closed on
Dec 2, 2005
Sold by
Investors Capital Llc
Bought by
Drake Hollis Marie
Purchase Details
Closed on
Dec 1, 2005
Sold by
Yoon Se Young
Bought by
Investors Capital Llc
Create a Home Valuation Report for This Property
The Home Valuation Report is an in-depth analysis detailing your home's value as well as a comparison with similar homes in the area
Home Values in the Area
Average Home Value in this Area
Purchase History
| Date | Buyer | Sale Price | Title Company |
|---|---|---|---|
| Mathias Molly K | -- | Security Title Services | |
| Mathias Matthew J | -- | None Available | |
| Drake Hollis Marie | -- | None Available | |
| Investors Capital Llc | $120,500 | None Available |
Source: Public Records
Mortgage History
| Date | Status | Borrower | Loan Amount |
|---|---|---|---|
| Open | Mathias Molly K | $152,750 | |
| Closed | Mathias Matthew J | $152,683 |
Source: Public Records
Tax History Compared to Growth
Tax History
| Year | Tax Paid | Tax Assessment Tax Assessment Total Assessment is a certain percentage of the fair market value that is determined by local assessors to be the total taxable value of land and additions on the property. | Land | Improvement |
|---|---|---|---|---|
| 2024 | $2,847 | $285,900 | $46,100 | $239,800 |
| 2023 | $2,847 | $267,000 | $46,100 | $220,900 |
| 2022 | $2,712 | $237,500 | $46,100 | $191,400 |
| 2021 | $2,303 | $205,100 | $46,100 | $159,000 |
| 2020 | $2,185 | $196,200 | $46,100 | $150,100 |
| 2019 | $2,077 | $188,300 | $42,100 | $146,200 |
| 2018 | $1,859 | $173,700 | $42,100 | $131,600 |
| 2017 | $1,801 | $171,200 | $42,100 | $129,100 |
| 2016 | $1,709 | $165,700 | $42,100 | $123,600 |
| 2014 | $1,442 | $153,600 | $42,100 | $111,500 |
| 2013 | $1,442 | $146,200 | $42,100 | $104,100 |
Source: Public Records
Map
Nearby Homes
- 12966 Pleasant View Ln
- 13048 Ross Crossing
- 13068 Lamarque Place
- 13125 Zinfandel Place
- 10066 Perlita Place
- 10671 Pleasant View Ln
- 10150 Beresford Ct
- 10713 Summerwood Ln
- 11798 & 11842 E 131st St
- 10873 Glazer Way
- 12638 Granite Ridge Cir
- 10175 Pamona Ct
- 12783 Granite Ridge Cir
- 12662 Granite Ridge Cir
- 12807 Granite Ridge Cir
- 12650 Granite Ridge Cir
- 10523 Hollowood Ct
- 12687 Granite Ridge Cir
- 12991 Wingstem Ct
- 12959 Shandon Ln
- 12902 Turnham Dr
- 12932 Turnham Dr
- 12911 Rawlings Place
- 12892 Turnham Dr
- 12901 Rawlings Place
- 12931 Rawlings Place
- 12913 Turnham Dr
- 12891 Rawlings Place
- 12933 Turnham Dr
- 12903 Turnham Dr
- 12882 Turnham Dr
- 12962 Turnham Ct
- 12893 Turnham Dr
- 12943 Turnham Dr
- 12881 Rawlings Place
- 12951 Rawlings Ct
- 12953 Turnham Dr
- 12872 Turnham Dr
- 12972 Turnham Ct
- 12871 Rawlings Place