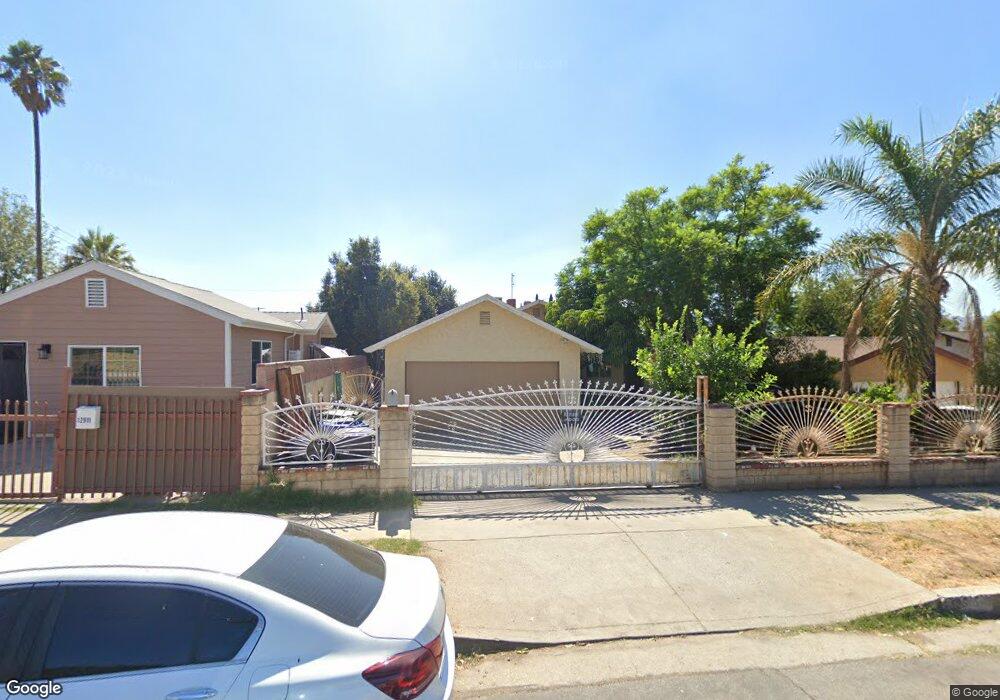
12915 Dronfield Ave Sylmar, CA 91342
Estimated Value: $741,412 - $880,000
3
Beds
1
Bath
1,320
Sq Ft
$604/Sq Ft
Est. Value
About This Home
This home is located at 12915 Dronfield Ave, Sylmar, CA 91342 and is currently estimated at $797,853, approximately $604 per square foot. 12915 Dronfield Ave is a home located in Los Angeles County with nearby schools including Gridley Street Elementary School, Olive Vista Middle School, and San Fernando Senior High School.
Ownership History
Date
Name
Owned For
Owner Type
Purchase Details
Closed on
Apr 24, 2017
Sold by
Lepe Miguel
Bought by
Carrillo Gone Jose H and Lepe Maria
Current Estimated Value
Home Financials for this Owner
Home Financials are based on the most recent Mortgage that was taken out on this home.
Original Mortgage
$254,375
Outstanding Balance
$211,155
Interest Rate
4.12%
Mortgage Type
FHA
Estimated Equity
$586,698
Purchase Details
Closed on
May 27, 2009
Sold by
Rodriguez Gustavo Ramirez and Ramirez Martha
Bought by
Lepe Miguel
Home Financials for this Owner
Home Financials are based on the most recent Mortgage that was taken out on this home.
Original Mortgage
$240,562
Interest Rate
4.78%
Mortgage Type
FHA
Purchase Details
Closed on
May 26, 2009
Sold by
Lepe Rafaela
Bought by
Lepe Miguel
Home Financials for this Owner
Home Financials are based on the most recent Mortgage that was taken out on this home.
Original Mortgage
$240,562
Interest Rate
4.78%
Mortgage Type
FHA
Create a Home Valuation Report for This Property
The Home Valuation Report is an in-depth analysis detailing your home's value as well as a comparison with similar homes in the area
Home Values in the Area
Average Home Value in this Area
Purchase History
| Date | Buyer | Sale Price | Title Company |
|---|---|---|---|
| Carrillo Gone Jose H | -- | Usa National Title Co | |
| Lepe Miguel | $245,000 | Lawyers Title Company | |
| Lepe Miguel | -- | Lawyers Title Company |
Source: Public Records
Mortgage History
| Date | Status | Borrower | Loan Amount |
|---|---|---|---|
| Open | Carrillo Gone Jose H | $254,375 | |
| Closed | Lepe Miguel | $240,562 |
Source: Public Records
Tax History
| Year | Tax Paid | Tax Assessment Tax Assessment Total Assessment is a certain percentage of the fair market value that is determined by local assessors to be the total taxable value of land and additions on the property. | Land | Improvement |
|---|---|---|---|---|
| 2025 | $5,050 | $404,354 | $257,784 | $146,570 |
| 2024 | $5,050 | $396,427 | $252,730 | $143,697 |
| 2023 | $4,956 | $388,655 | $247,775 | $140,880 |
| 2022 | $4,730 | $381,035 | $242,917 | $138,118 |
| 2021 | $4,669 | $373,564 | $238,154 | $135,410 |
| 2019 | $4,532 | $362,487 | $231,092 | $131,395 |
| 2018 | $4,456 | $355,380 | $226,561 | $128,819 |
| 2016 | $3,359 | $266,510 | $141,414 | $125,096 |
| 2015 | $3,312 | $262,507 | $139,290 | $123,217 |
| 2014 | $3,330 | $257,366 | $136,562 | $120,804 |
Source: Public Records
Map
Nearby Homes
- 13750 Hubbard St Unit 6
- 13750 Hubbard St Unit 77
- 1965 8th St
- 13040 Dronfield Ave Unit 12
- 13040 Dronfield Ave Unit 3
- 13040 Dronfield Ave Unit 25
- 2050 7th St
- 13050 Dronfield Ave Unit 21
- 14047 Herron St
- 13100 Bromont Ave Unit 11
- 13100 Bromont Ave Unit 15
- 13100 Bromont Ave Unit 46
- 13080 Dronfield Ave Unit 80
- 12888 Four Palms Ln
- 12870 Four Palms Ln
- 1926 Lucas St Unit 2
- 13540 Hubbard St Unit 10
- 1921 Glenoaks Blvd Unit 196
- 1617 Knox St
- 1929 Glenoaks Blvd Unit 122
- 12919 Dronfield Ave
- 13807 Hubbard St
- 13801 Hubbard St
- 12884 Sproule Ave
- 12925 Dronfield Ave
- 12888 Sproule Ave
- 12874 Sproule Ave
- 12880 Sproule Ave
- 12896 Sproule Ave
- 12933 Dronfield Ave
- 12904 Sproule Ave
- 12937 Dronfield Ave
- 13860 Aztec St
- 13831 Hubbard St
- 12910 Sproule Ave
- 13806 Hubbard St
- 13802 Hubbard St
- 13812 Hubbard St
- 13866 Aztec St
- 12947 Dronfield Ave
Your Personal Tour Guide
Ask me questions while you tour the home.