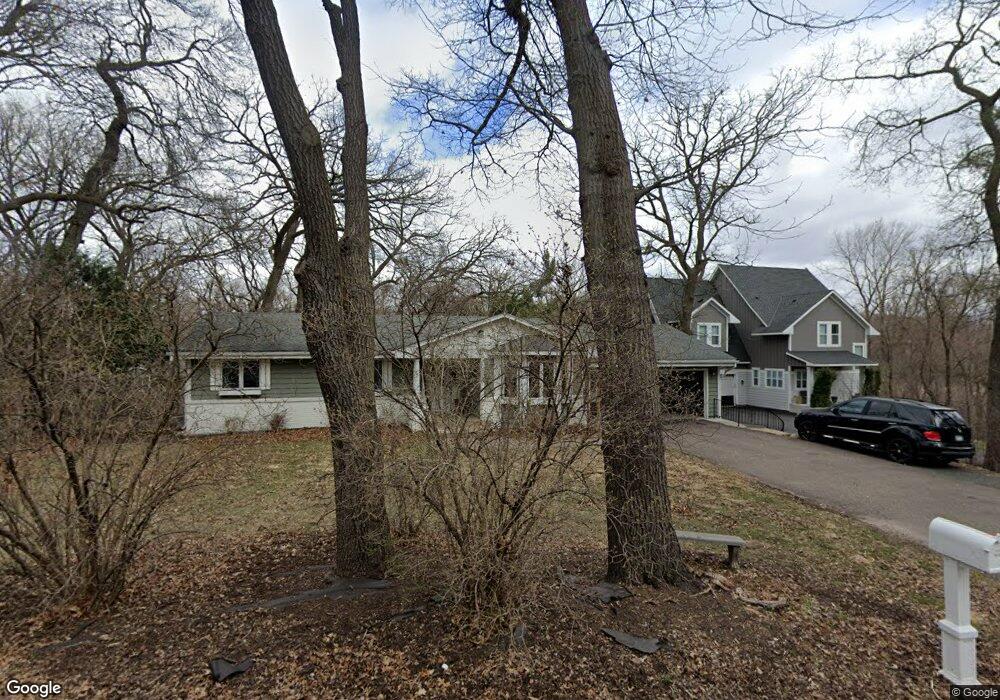
12918 Rutledge Cir Hopkins, MN 55305
Minnetonka Mills NeighborhoodEstimated Value: $512,000 - $626,000
3
Beds
2
Baths
2,490
Sq Ft
$225/Sq Ft
Est. Value
About This Home
This home is located at 12918 Rutledge Cir, Hopkins, MN 55305 and is currently estimated at $560,687, approximately $225 per square foot. 12918 Rutledge Cir is a home located in Hennepin County with nearby schools including Eisenhower Elementary School, Hopkins West Junior High School, and Hopkins Senior High School.
Ownership History
Date
Name
Owned For
Owner Type
Purchase Details
Closed on
May 2, 2019
Sold by
Grunerud Dane E and Grunerud Megan
Bought by
Theisen Jackson S and Vasile Maryan
Current Estimated Value
Home Financials for this Owner
Home Financials are based on the most recent Mortgage that was taken out on this home.
Original Mortgage
$313,600
Outstanding Balance
$274,592
Interest Rate
4%
Mortgage Type
New Conventional
Estimated Equity
$286,095
Purchase Details
Closed on
Jun 29, 2015
Sold by
Lakewest Maki Llc
Bought by
Grunerud Dane E
Home Financials for this Owner
Home Financials are based on the most recent Mortgage that was taken out on this home.
Original Mortgage
$280,000
Interest Rate
4.09%
Mortgage Type
New Conventional
Purchase Details
Closed on
Sep 28, 2004
Sold by
Harris Thomas and Harris Patricia
Bought by
Maki Karen
Purchase Details
Closed on
Jul 7, 2000
Sold by
Mack Andrew J and Mack Christine M
Bought by
Harris Thomas G and Harris Patricia L
Create a Home Valuation Report for This Property
The Home Valuation Report is an in-depth analysis detailing your home's value as well as a comparison with similar homes in the area
Home Values in the Area
Average Home Value in this Area
Purchase History
| Date | Buyer | Sale Price | Title Company |
|---|---|---|---|
| Theisen Jackson S | $392,000 | Trademark Title Services Inc | |
| Theisen Jackson S | $392,000 | Trademark Title Services Inc | |
| Grunerud Dane E | $350,000 | Sherburne Co Abstract & Titl | |
| Grunerud Dane E | $350,000 | Sherburne Co Abstract & Titl | |
| Maki Karen | $312,500 | -- | |
| Harris Thomas G | $178,000 | -- |
Source: Public Records
Mortgage History
| Date | Status | Borrower | Loan Amount |
|---|---|---|---|
| Open | Theisen Jackson S | $313,600 | |
| Closed | Theisen Jackson S | $313,600 | |
| Previous Owner | Grunerud Dane E | $280,000 |
Source: Public Records
Tax History Compared to Growth
Tax History
| Year | Tax Paid | Tax Assessment Tax Assessment Total Assessment is a certain percentage of the fair market value that is determined by local assessors to be the total taxable value of land and additions on the property. | Land | Improvement |
|---|---|---|---|---|
| 2024 | $6,099 | $499,000 | $213,400 | $285,600 |
| 2023 | $5,978 | $504,700 | $213,400 | $291,300 |
| 2022 | $5,303 | $481,700 | $213,400 | $268,300 |
| 2021 | $5,043 | $421,400 | $194,000 | $227,400 |
| 2020 | $5,129 | $406,100 | $184,000 | $222,100 |
| 2019 | $4,827 | $392,500 | $184,000 | $208,500 |
| 2018 | $4,589 | $374,200 | $184,000 | $190,200 |
| 2017 | $4,571 | $339,700 | $169,700 | $170,000 |
| 2016 | $3,576 | $265,200 | $148,500 | $116,700 |
| 2015 | -- | $253,500 | $150,000 | $103,500 |
| 2014 | -- | $230,400 | $150,000 | $80,400 |
Source: Public Records
Map
Nearby Homes
- 13111 April Ln
- 2890 Ella Ln
- 12924 Inverness Rd
- 3521 Elm Ln
- 2711 Bent Tree Cir
- 3020 Saint Albans Mill Rd Unit 106
- 3020 Saint Albans Mill Rd Unit 312
- 3030 Saint Albans Mill Rd Unit 115
- 3000 Saint Albans Mill Rd Unit 109
- 3056 Saint Albans Hollow Cir
- 11984 Saint Albans Hollow Dr
- 14323 Mcginty Rd W
- 12476 Orchard Rd
- 13228 Orchard Rd
- 2509 Cherrywood Rd
- 3656 Robin Ln
- 13113 Orchard Rd
- 2508 Cheyenne Cir
- 2935 Minnehaha Curve
- 11643 Foxhall Rd
- 12910 Rutledge Cir
- 12910 Rutledge Cir
- 12926 Rutledge Cir
- 12929 Stanton Dr
- 12937 Stanton Dr
- 12925 Rutledge Cir
- 12938 Rutledge Cir
- 13003 Stanton Dr
- 12935 Rutledge Cir
- 12936 Stanton Dr
- 13011 Stanton Dr
- 12950 Rutledge Cir
- 12801 Stanton Dr
- 13000 Stanton Dr
- 12965 Rutledge Cir
- 3133 Vicki Ln
- 3147 Vicki Ln
- 13019 Stanton Dr
- 13008 Stanton Dr
- 3157 Vicki Ln