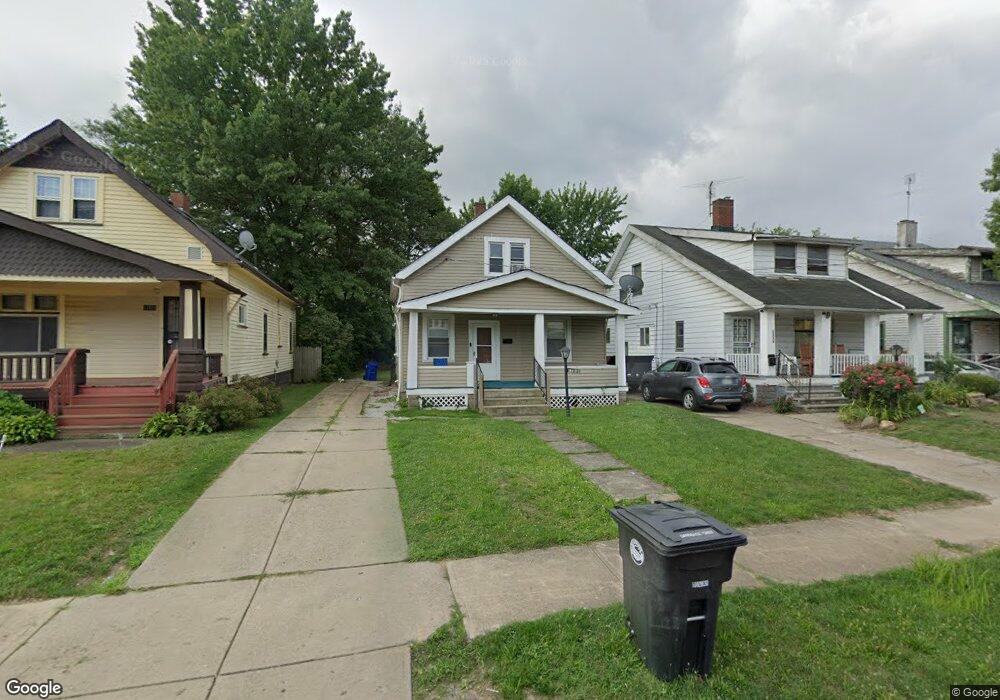
12918 Watterson Ave Cleveland, OH 44105
Corlett NeighborhoodEstimated Value: $61,000 - $154,000
2
Beds
1
Bath
1,016
Sq Ft
$85/Sq Ft
Est. Value
About This Home
This home is located at 12918 Watterson Ave, Cleveland, OH 44105 and is currently estimated at $86,843, approximately $85 per square foot. 12918 Watterson Ave is a home located in Cuyahoga County with nearby schools including Andrew J. Rickoff School, Adlai Stevenson School, and Anton Grdina School.
Ownership History
Date
Name
Owned For
Owner Type
Purchase Details
Closed on
May 8, 2025
Sold by
Cuyahoga County Land Reutilization Corpo
Bought by
Nupoint Community Development Corporation
Current Estimated Value
Purchase Details
Closed on
Apr 30, 2025
Sold by
Nupoint Community Development Corporatio
Bought by
Dash Property Investments Llc
Purchase Details
Closed on
Apr 27, 2018
Sold by
Hawkins David W
Bought by
Hawkins Edward J
Purchase Details
Closed on
Apr 28, 2000
Sold by
Williams Becks Theresa L
Bought by
Hawkins David and Hawkins Kathleen
Home Financials for this Owner
Home Financials are based on the most recent Mortgage that was taken out on this home.
Original Mortgage
$60,250
Interest Rate
8.24%
Purchase Details
Closed on
Jul 28, 1980
Sold by
Williams Samuel G
Bought by
Williams T L
Purchase Details
Closed on
May 6, 1976
Bought by
Williams Samuel G
Purchase Details
Closed on
Jan 1, 1975
Bought by
United Savings Assoc
Create a Home Valuation Report for This Property
The Home Valuation Report is an in-depth analysis detailing your home's value as well as a comparison with similar homes in the area
Home Values in the Area
Average Home Value in this Area
Purchase History
| Date | Buyer | Sale Price | Title Company |
|---|---|---|---|
| Nupoint Community Development Corporation | -- | None Listed On Document | |
| Dash Property Investments Llc | $5,000 | Mount Morris Title | |
| Hawkins Edward J | -- | None Available | |
| Hawkins David | $67,000 | Brooklyn Title Agency Inc | |
| Williams T L | -- | -- | |
| Williams Samuel G | $12,500 | -- | |
| United Savings Assoc | -- | -- |
Source: Public Records
Mortgage History
| Date | Status | Borrower | Loan Amount |
|---|---|---|---|
| Previous Owner | Hawkins David | $60,250 |
Source: Public Records
Tax History Compared to Growth
Tax History
| Year | Tax Paid | Tax Assessment Tax Assessment Total Assessment is a certain percentage of the fair market value that is determined by local assessors to be the total taxable value of land and additions on the property. | Land | Improvement |
|---|---|---|---|---|
| 2024 | $1,440 | $21,525 | $4,375 | $17,150 |
| 2023 | $988 | $12,740 | $2,870 | $9,870 |
| 2022 | $961 | $12,740 | $2,870 | $9,870 |
| 2021 | $951 | $12,740 | $2,870 | $9,870 |
| 2020 | $950 | $10,990 | $2,490 | $8,510 |
| 2019 | $878 | $31,400 | $7,100 | $24,300 |
| 2018 | $986 | $10,990 | $2,490 | $8,510 |
| 2017 | $1,083 | $12,810 | $2,100 | $10,710 |
| 2016 | $1,075 | $12,810 | $2,100 | $10,710 |
| 2015 | $14,341 | $12,810 | $2,100 | $10,710 |
| 2014 | $14,341 | $15,060 | $2,490 | $12,570 |
Source: Public Records
Map
Nearby Homes
- 12810 Benwood Ave
- 12925 Watterson Ave
- 13207 Crennell Ave
- 13300 Benwood Ave
- 13302 Durkee Ave
- 12700 Lenacrave Ave
- 12506 Dove Ave
- 13001 Ferris Ave
- 12309 Watterson Ave
- 12822 Ferris Ave
- 12604 Angelus Ave
- 13409 Glendale Ave
- 3995 E 121st St
- 13217 Marston Ave
- 13205 Southview Ave
- 12503 Marston Ave
- 3950 E 121st St
- 12613 Revere Ave
- 3951 E 120th St
- 13801 Edgewood Ave
- 12912 Watterson Ave
- 12922 Watterson Ave
- 12908 Watterson Ave
- 13000 Watterson Ave
- 12904 Watterson Ave
- 12815 Benwood Ave
- 12901 Benwood Ave
- 12905 Benwood Ave
- 12900 Watterson Ave
- 12909 Benwood Ave
- 12813 Benwood Ave
- 12812 Watterson Ave
- 12917 Watterson Ave
- 12921 Watterson Ave
- 3954 E 131st St
- 12909 Watterson Ave
- 12811 Benwood Ave
- 12905 Watterson Ave
- 3960 E 131st St
- 12808 Watterson Ave