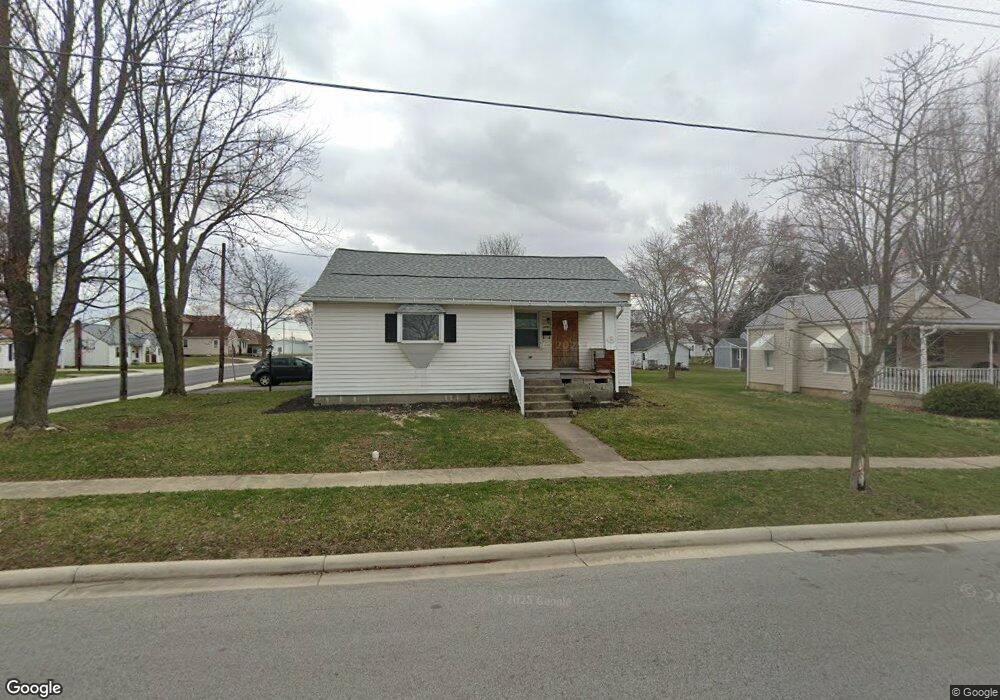
1292 E 3rd St Ottawa, OH 45875
Estimated Value: $143,000 - $194,000
Studio
1
Bath
1,494
Sq Ft
$115/Sq Ft
Est. Value
About This Home
This home is located at 1292 E 3rd St, Ottawa, OH 45875 and is currently estimated at $171,242, approximately $114 per square foot. 1292 E 3rd St is a home located in Putnam County with nearby schools including Ottawa-Glandorf High School and Sts. Peter & Paul Catholic School.
Ownership History
Date
Name
Owned For
Owner Type
Purchase Details
Closed on
Jan 15, 2021
Sold by
Haughn Chad D
Bought by
Roberts Destine E
Current Estimated Value
Home Financials for this Owner
Home Financials are based on the most recent Mortgage that was taken out on this home.
Original Mortgage
$70,000
Outstanding Balance
$61,901
Interest Rate
2.71%
Mortgage Type
New Conventional
Estimated Equity
$109,342
Create a Home Valuation Report for This Property
The Home Valuation Report is an in-depth analysis detailing your home's value as well as a comparison with similar homes in the area
Home Values in the Area
Average Home Value in this Area
Purchase History
| Date | Buyer | Sale Price | Title Company |
|---|---|---|---|
| Roberts Destine E | -- | None Listed On Document | |
| Roberts Destine E | -- | None Listed On Document |
Source: Public Records
Mortgage History
| Date | Status | Borrower | Loan Amount |
|---|---|---|---|
| Open | Roberts Destine E | $70,000 | |
| Closed | Roberts Destine E | $70,000 |
Source: Public Records
Tax History
| Year | Tax Paid | Tax Assessment Tax Assessment Total Assessment is a certain percentage of the fair market value that is determined by local assessors to be the total taxable value of land and additions on the property. | Land | Improvement |
|---|---|---|---|---|
| 2025 | $1,304 | $38,260 | $4,850 | $33,410 |
| 2024 | $1,278 | $38,260 | $4,850 | $33,410 |
| 2023 | $1,277 | $24,740 | $3,770 | $20,970 |
| 2022 | $939 | $24,739 | $3,770 | $20,969 |
| 2021 | $1,127 | $24,880 | $3,770 | $21,110 |
| 2020 | $954 | $20,550 | $3,380 | $17,170 |
| 2019 | $785 | $20,850 | $3,770 | $17,080 |
| 2018 | $766 | $20,850 | $3,770 | $17,080 |
| 2017 | $778 | $20,850 | $3,770 | $17,080 |
| 2016 | $748 | $20,550 | $3,380 | $17,170 |
| 2015 | $754 | $20,550 | $3,380 | $17,170 |
| 2014 | $743 | $20,550 | $3,380 | $17,170 |
| 2013 | $740 | $20,550 | $3,380 | $17,170 |
Source: Public Records
Map
Nearby Homes
- 238 N Ohio Ave
- 1535 E 3rd St
- 1731 S Agner St
- 740 E Main St
- 0 Sapphire St Unit 225029940
- 0 Sapphire St Unit 225046385
- 717 E 2nd St
- 1823 S Agner St
- 370 S Thomas St
- 1997 E Main St
- 715 N Perry St
- 309 Oakview Dr
- 717 & 717 1/2 & 721 E Third St
- 331 Chippewa Dr
- 113 Crabapple Ln
- 9896 Road M
- 9410 Road H
- 5666 State Route 224
- 12806 Road K
- 13592 Ohio 694
Your Personal Tour Guide
Ask me questions while you tour the home.