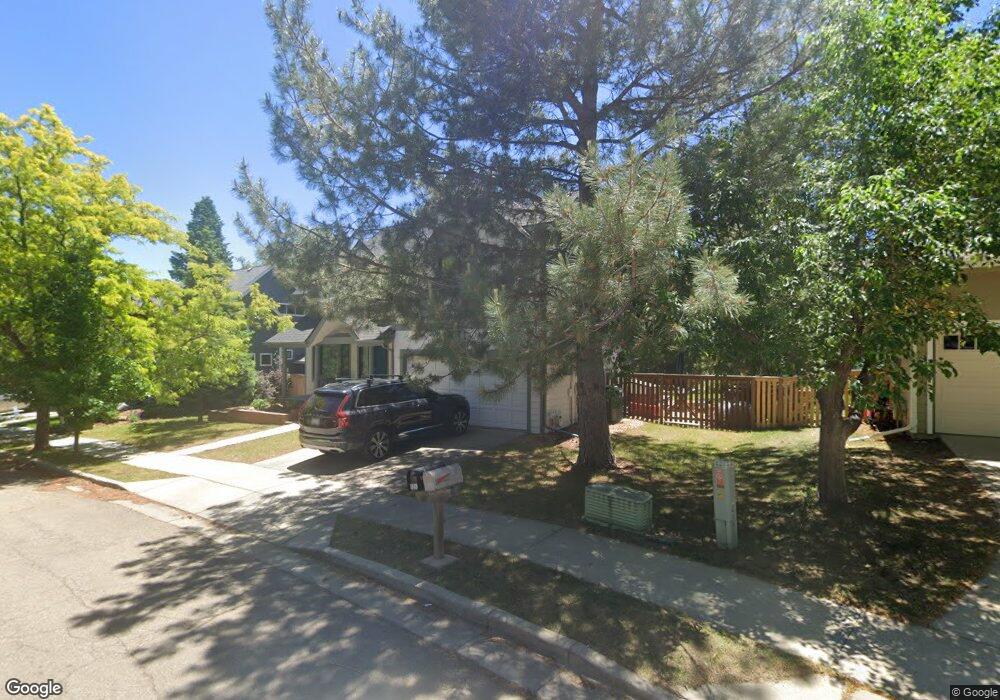
1292 Oakleaf Cir Boulder, CO 80304
North Boulder NeighborhoodEstimated Value: $1,490,514 - $1,852,000
3
Beds
3
Baths
2,038
Sq Ft
$829/Sq Ft
Est. Value
About This Home
This home is located at 1292 Oakleaf Cir, Boulder, CO 80304 and is currently estimated at $1,689,629, approximately $829 per square foot. 1292 Oakleaf Cir is a home located in Boulder County with nearby schools including Crest View Elementary School, Centennial Middle School, and Boulder High School.
Ownership History
Date
Name
Owned For
Owner Type
Purchase Details
Closed on
Jul 12, 2011
Sold by
Munier Daniel
Bought by
Smith Erika
Current Estimated Value
Purchase Details
Closed on
Dec 8, 2009
Sold by
Currier David H
Bought by
Munier Daniel
Home Financials for this Owner
Home Financials are based on the most recent Mortgage that was taken out on this home.
Original Mortgage
$315,000
Interest Rate
5.01%
Mortgage Type
New Conventional
Purchase Details
Closed on
Dec 29, 1999
Sold by
Currier David H and Currier Cecily W
Bought by
Currier David Henry
Home Financials for this Owner
Home Financials are based on the most recent Mortgage that was taken out on this home.
Original Mortgage
$234,000
Interest Rate
7.84%
Purchase Details
Closed on
Jun 3, 1993
Bought by
Smith Erika
Purchase Details
Closed on
Dec 21, 1992
Bought by
Smith Erika
Create a Home Valuation Report for This Property
The Home Valuation Report is an in-depth analysis detailing your home's value as well as a comparison with similar homes in the area
Home Values in the Area
Average Home Value in this Area
Purchase History
| Date | Buyer | Sale Price | Title Company |
|---|---|---|---|
| Smith Erika | -- | None Available | |
| Munier Daniel | $630,000 | Htco | |
| Currier David Henry | -- | -- | |
| Smith Erika | $211,000 | -- | |
| Smith Erika | -- | -- |
Source: Public Records
Mortgage History
| Date | Status | Borrower | Loan Amount |
|---|---|---|---|
| Previous Owner | Munier Daniel | $315,000 | |
| Previous Owner | Currier David Henry | $234,000 |
Source: Public Records
Tax History
| Year | Tax Paid | Tax Assessment Tax Assessment Total Assessment is a certain percentage of the fair market value that is determined by local assessors to be the total taxable value of land and additions on the property. | Land | Improvement |
|---|---|---|---|---|
| 2025 | $9,276 | $98,207 | $42,813 | $55,394 |
| 2024 | $9,276 | $98,207 | $42,813 | $55,394 |
| 2023 | $9,115 | $105,545 | $44,254 | $64,977 |
| 2022 | $7,622 | $82,072 | $35,702 | $46,370 |
| 2021 | $7,268 | $84,435 | $36,730 | $47,705 |
| 2020 | $5,616 | $64,514 | $32,890 | $31,624 |
| 2019 | $5,530 | $64,514 | $32,890 | $31,624 |
| 2018 | $5,189 | $59,846 | $24,336 | $35,510 |
| 2017 | $5,026 | $66,164 | $26,905 | $39,259 |
| 2016 | $5,239 | $60,519 | $24,198 | $36,321 |
| 2015 | $4,961 | $50,156 | $25,154 | $25,002 |
| 2014 | $4,217 | $50,156 | $25,154 | $25,002 |
Source: Public Records
Map
Nearby Homes
- 3850 Broadway St Unit 24
- 1245 Norwood Ave Unit 42
- 1180 Oakdale Place
- 1110 Poplar Ave
- 1505 Oak Ave
- 1285 Meadow Place
- 4893 Broadway
- 3776 Orange Ln
- 1205 Meadow Ave
- 1695 Orchard Ave
- 1095 Redwood Ave
- 1690 Wilson Ct
- 1560 Sumac Ave
- 1205 Sumac Ave
- 3660 16th St
- 785 Northstar Ct
- 670 Quince Cir
- 630 Northstar Ct
- 1801 Redwood Ave
- 3560 16th St
- 1308 Oakleaf Cir
- 1270 Oakleaf Cir
- 1305 Oak Ct
- 1285 Oakleaf Cir
- 1303 Oakleaf Cir
- 1315 Oak Ct
- 1316 Oakleaf Cir
- 1258 Oakleaf Cir
- 1244 Oakleaf Cir
- 1311 Oakleaf Cir
- 1300 Oak Ct
- 1282 Periwinkle Dr
- 1320 Periwinkle Dr
- 1344 Oakleaf Cir
- 3850 Broadway St Unit 23
- 3850 Broadway St Unit 22
- 3850 Broadway St Unit 21
- 3850 Broadway St Unit 20
- 3850 Broadway St Unit 19
- 3850 Broadway St Unit 3850
Your Personal Tour Guide
Ask me questions while you tour the home.