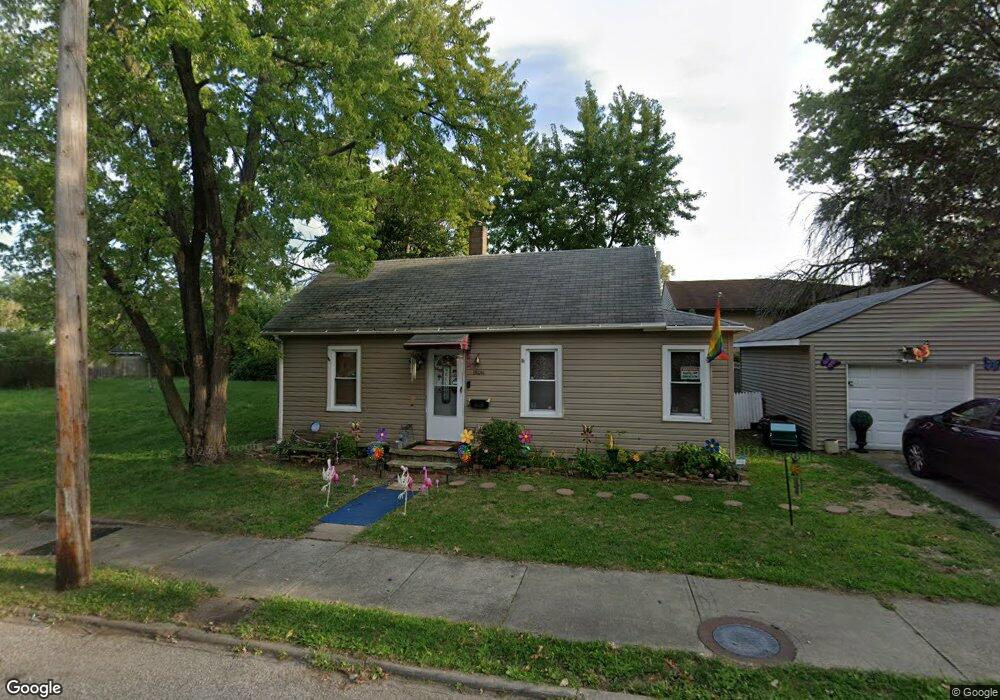
12921 Matherson Ave Cleveland, OH 44135
Bellaire-Puritas NeighborhoodEstimated Value: $90,000 - $127,000
2
Beds
1
Bath
741
Sq Ft
$141/Sq Ft
Est. Value
About This Home
This home is located at 12921 Matherson Ave, Cleveland, OH 44135 and is currently estimated at $104,792, approximately $141 per square foot. 12921 Matherson Ave is a home located in Cuyahoga County with nearby schools including Artemus Ward School, Almira Academy, and Benjamin Franklin.
Ownership History
Date
Name
Owned For
Owner Type
Purchase Details
Closed on
Jun 23, 2014
Sold by
Nl Nemer Llc
Bought by
Tlc Homes Llc
Current Estimated Value
Purchase Details
Closed on
Mar 31, 2010
Sold by
Jadrych Jeffrey
Bought by
Jls Associates Financial Services
Purchase Details
Closed on
Mar 30, 2010
Sold by
Jis & Associates Financial Services
Bought by
Nl Nemer Llc
Purchase Details
Closed on
Apr 18, 2008
Sold by
Reca Lp
Bought by
Jadrych Jeffrey
Purchase Details
Closed on
Feb 27, 2008
Sold by
Fannie Mae
Bought by
Reca Lp
Purchase Details
Closed on
Jul 31, 2007
Sold by
Lemieux Mark
Bought by
Federal National Mortgage Association
Purchase Details
Closed on
Jul 26, 2001
Sold by
Coleman Charles R
Bought by
Lemieux Mark
Home Financials for this Owner
Home Financials are based on the most recent Mortgage that was taken out on this home.
Original Mortgage
$35,100
Interest Rate
7.14%
Purchase Details
Closed on
Jan 1, 1975
Bought by
Coleman Charles R
Create a Home Valuation Report for This Property
The Home Valuation Report is an in-depth analysis detailing your home's value as well as a comparison with similar homes in the area
Home Values in the Area
Average Home Value in this Area
Purchase History
| Date | Buyer | Sale Price | Title Company |
|---|---|---|---|
| Tlc Homes Llc | $20,833 | River Title Company | |
| Jls Associates Financial Services | $12,000 | None Available | |
| Nl Nemer Llc | $21,000 | None Available | |
| Jadrych Jeffrey | $7,000 | None Available | |
| Reca Lp | $3,095 | Accutitle Agency | |
| Federal National Mortgage Association | $45,394 | Attorney | |
| Lemieux Mark | $39,000 | Rockwell Title Agency Inc | |
| Coleman Charles R | -- | -- |
Source: Public Records
Mortgage History
| Date | Status | Borrower | Loan Amount |
|---|---|---|---|
| Previous Owner | Lemieux Mark | $35,100 |
Source: Public Records
Tax History Compared to Growth
Tax History
| Year | Tax Paid | Tax Assessment Tax Assessment Total Assessment is a certain percentage of the fair market value that is determined by local assessors to be the total taxable value of land and additions on the property. | Land | Improvement |
|---|---|---|---|---|
| 2024 | $1,864 | $27,860 | $8,435 | $19,425 |
| 2023 | $983 | $12,680 | $4,240 | $8,440 |
| 2022 | $977 | $12,670 | $4,240 | $8,440 |
| 2021 | $968 | $12,670 | $4,240 | $8,440 |
| 2020 | $869 | $9,840 | $3,290 | $6,550 |
| 2019 | $805 | $28,100 | $9,400 | $18,700 |
| 2018 | $706 | $9,840 | $3,290 | $6,550 |
| 2017 | $615 | $7,280 | $2,870 | $4,410 |
| 2016 | $611 | $7,280 | $2,870 | $4,410 |
| 2015 | $1,053 | $7,280 | $2,870 | $4,410 |
| 2014 | $1,053 | $12,500 | $3,120 | $9,380 |
Source: Public Records
Map
Nearby Homes
- 4059 W 130th St
- 13206 Liberty Ave
- 13209 Liberty Ave
- 13313 Highlandview Ave
- 12508 Sobieski Ave
- 12312 Guardian Blvd
- 12620 Grimsby Ave
- 13402 Saint James Ave
- 13301 Courtland Ave
- 12510 Grimsby Ave
- 3958 W 130th St
- 12400 Saint John Ave
- 4329 W 131st St
- 12605 Brooklawn Ave
- 12510 Summerland Ave
- 3918 Brookside Blvd
- 11913 Matherson Ave
- 4162 Victory Blvd
- 4349 W 132nd St
- 3882 W 132nd St
- 12913 Matherson Ave
- 12910 Matherson Ave
- 4115 W 130th St
- 12907 Matherson Ave
- 12916 Leeila Ave
- 12908 Matherson Ave
- 4111 W 130th St
- 12901 Matherson Ave
- 12906 Matherson Ave
- 12908 Leeila Ave
- 12921 Leeila Ave
- 4107 W 130th St
- 12904 Matherson Ave
- 12913 Guardian Blvd
- 13012 Liberty Ave
- 13009 Liberty Ave
- 4103 W 130th St
- 12902 Matherson Ave
- 12813 Matherson Ave
- 12917 Leeila Ave