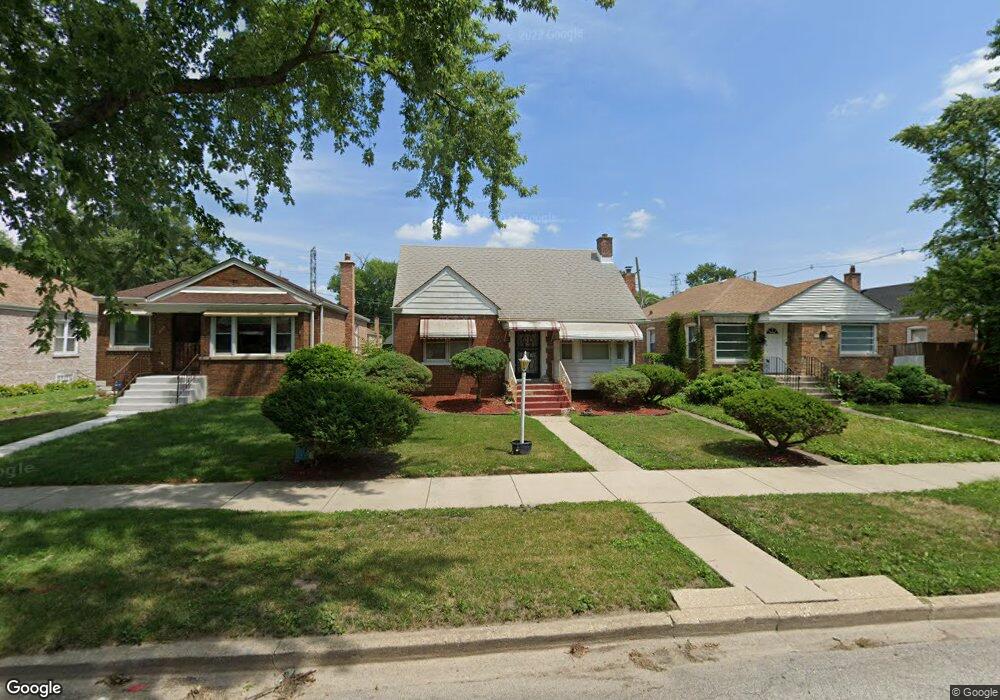
12923 S Normal Ave Chicago, IL 60628
West Pullman NeighborhoodEstimated Value: $101,000 - $163,000
2
Beds
1
Bath
1,125
Sq Ft
$128/Sq Ft
Est. Value
About This Home
This home is located at 12923 S Normal Ave, Chicago, IL 60628 and is currently estimated at $143,689, approximately $127 per square foot. 12923 S Normal Ave is a home located in Cook County with nearby schools including Ronald Brown Academy, Fenger Academy High School, and Mariah's Learning Center.
Ownership History
Date
Name
Owned For
Owner Type
Purchase Details
Closed on
Jul 13, 2023
Sold by
Hochhauser Adele
Bought by
Johnson Beverly
Current Estimated Value
Home Financials for this Owner
Home Financials are based on the most recent Mortgage that was taken out on this home.
Original Mortgage
$92,150
Interest Rate
7.13%
Mortgage Type
New Conventional
Purchase Details
Closed on
Feb 23, 2023
Sold by
Venture Four Llc
Bought by
Hochhauser Adele
Purchase Details
Closed on
Feb 8, 2023
Sold by
Yarbrough Karen A
Bought by
Venture Four Llc
Purchase Details
Closed on
Apr 30, 2018
Sold by
Wheeler Financial Inc
Bought by
Hairston Beverly Johnson and Roberts Sean Eric
Purchase Details
Closed on
Jul 19, 2017
Sold by
County Of Cook
Bought by
Wheeler Financial Inc
Create a Home Valuation Report for This Property
The Home Valuation Report is an in-depth analysis detailing your home's value as well as a comparison with similar homes in the area
Home Values in the Area
Average Home Value in this Area
Purchase History
| Date | Buyer | Sale Price | Title Company |
|---|---|---|---|
| Johnson Beverly | $95,000 | None Listed On Document | |
| Hochhauser Adele | $70,000 | None Listed On Document | |
| Venture Four Llc | -- | None Listed On Document | |
| Venture Four Llc | -- | None Listed On Document | |
| Hairston Beverly Johnson | -- | Attorney | |
| Wheeler Financial Inc | -- | Attorney |
Source: Public Records
Mortgage History
| Date | Status | Borrower | Loan Amount |
|---|---|---|---|
| Previous Owner | Johnson Beverly | $92,150 |
Source: Public Records
Tax History
| Year | Tax Paid | Tax Assessment Tax Assessment Total Assessment is a certain percentage of the fair market value that is determined by local assessors to be the total taxable value of land and additions on the property. | Land | Improvement |
|---|---|---|---|---|
| 2025 | $1,375 | $18,000 | $2,850 | $15,150 |
| 2024 | $1,375 | $18,000 | $2,850 | $15,150 |
| 2023 | $1,341 | $6,500 | $2,375 | $4,125 |
| 2022 | $1,341 | $6,500 | $2,375 | $4,125 |
| 2021 | $1,311 | $6,500 | $2,375 | $4,125 |
| 2020 | $1,745 | $7,816 | $2,612 | $5,204 |
| 2019 | $1,730 | $8,589 | $2,612 | $5,977 |
| 2018 | $1,701 | $8,589 | $2,612 | $5,977 |
| 2017 | $2,216 | $10,273 | $2,375 | $7,898 |
| 2016 | $2,062 | $10,273 | $2,375 | $7,898 |
| 2015 | $1,887 | $10,273 | $2,375 | $7,898 |
| 2014 | $1,892 | $10,174 | $2,137 | $8,037 |
| 2013 | $1,855 | $10,174 | $2,137 | $8,037 |
Source: Public Records
Map
Nearby Homes
- 12864 S Eggleston Ave
- 12752 S Wallace St
- 12748 S Lowe Ave
- 550 W 127th St
- 12643 S Harvard Ave
- 12600 S Stewart Ave
- 12600 S Wallace St
- 442 W 126th St
- 12551 S Eggleston Ave
- 12632 S Emerald Ave
- 12527 S Lowe Ave
- 14450 S Sangamon St
- 12532 S Union Ave
- 12617 S Wentworth Ave
- 948 W Vermont Ave
- 1021 W Vermont Ave
- 12946 S Carpenter St
- 12930 S Carpenter St
- 12420 S Emerald Ave
- 12358 S Lowe Ave
- 12927 S Normal Ave
- 12919 S Normal Ave
- 12931 S Normal Ave
- 12915 S Normal Ave
- 12911 S Normal Ave
- 12922 S Eggleston Ave
- 12928 S Eggleston Ave
- 12907 S Normal Ave
- 12918 S Eggleston Ave
- 12930 S Eggleston Ave
- 12914 S Eggleston Ave
- 454 W 129th Place
- 450 W 129th Place
- 458 W 129th Place
- 12922 S Normal Ave
- 12903 S Normal Ave
- 12926 S Normal Ave
- 446 W 129th Place
- 12918 S Normal Ave
- 12910 S Eggleston Ave
Your Personal Tour Guide
Ask me questions while you tour the home.