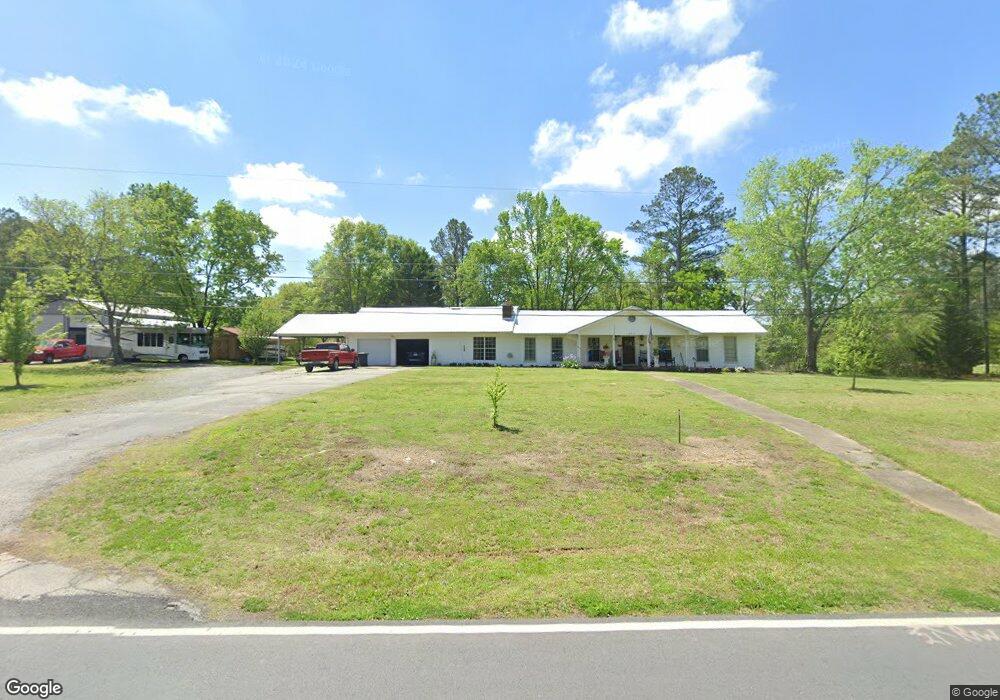
1293 Bellview Rd Rockmart, GA 30153
Estimated Value: $231,000 - $327,000
3
Beds
2
Baths
2,709
Sq Ft
$103/Sq Ft
Est. Value
About This Home
This home is located at 1293 Bellview Rd, Rockmart, GA 30153 and is currently estimated at $277,752, approximately $102 per square foot. 1293 Bellview Rd is a home located in Polk County with nearby schools including Rockmart Middle School.
Ownership History
Date
Name
Owned For
Owner Type
Purchase Details
Closed on
Aug 31, 2015
Sold by
Pittman Lori S
Bought by
Shirah Bobby E and Shirah Myrtie Ruth
Current Estimated Value
Purchase Details
Closed on
Aug 13, 2015
Sold by
Pittman Daniel G
Bought by
Pittman Lori S
Purchase Details
Closed on
Sep 20, 1995
Sold by
Crabtree Ronnie and Crabtree Lori B
Bought by
Pittman Daniel G and Pittman Lori S
Purchase Details
Closed on
Jul 7, 1992
Sold by
Campbell Robert K
Bought by
Crabtree Ronnie and Crabtree Lori B
Purchase Details
Closed on
May 5, 1983
Sold by
Williams Cynthia S
Bought by
Campbell Robert
Purchase Details
Closed on
Feb 12, 1980
Sold by
First Fed Savings
Bought by
Williams Cynthia S
Purchase Details
Closed on
Jun 6, 1979
Sold by
Camp Nettie Faye
Bought by
First Fed Savings
Purchase Details
Closed on
Sep 30, 1978
Sold by
Camp Benjamin
Bought by
Camp Nettie Faye
Purchase Details
Closed on
Nov 11, 1971
Bought by
Camp Benjamin
Create a Home Valuation Report for This Property
The Home Valuation Report is an in-depth analysis detailing your home's value as well as a comparison with similar homes in the area
Home Values in the Area
Average Home Value in this Area
Purchase History
| Date | Buyer | Sale Price | Title Company |
|---|---|---|---|
| Shirah Bobby E | $75,000 | -- | |
| Pittman Lori S | -- | -- | |
| Pittman Daniel G | $63,500 | -- | |
| Crabtree Ronnie | $59,000 | -- | |
| Campbell Robert | -- | -- | |
| Williams Cynthia S | -- | -- | |
| First Fed Savings | -- | -- | |
| Camp Nettie Faye | -- | -- | |
| Camp Benjamin | -- | -- |
Source: Public Records
Tax History Compared to Growth
Tax History
| Year | Tax Paid | Tax Assessment Tax Assessment Total Assessment is a certain percentage of the fair market value that is determined by local assessors to be the total taxable value of land and additions on the property. | Land | Improvement |
|---|---|---|---|---|
| 2024 | $1,177 | $88,322 | $4,050 | $84,272 |
| 2023 | $813 | $66,242 | $4,050 | $62,192 |
| 2022 | $650 | $59,372 | $2,700 | $56,672 |
| 2021 | $591 | $56,564 | $2,700 | $53,864 |
| 2020 | $592 | $56,564 | $2,700 | $53,864 |
| 2019 | $329 | $44,249 | $2,700 | $41,549 |
| 2018 | $1,154 | $41,893 | $2,700 | $39,193 |
| 2017 | $1,140 | $41,893 | $2,700 | $39,193 |
| 2016 | $816 | $41,193 | $2,000 | $39,193 |
| 2015 | $1,306 | $47,858 | $2,000 | $45,858 |
| 2014 | $1,316 | $47,858 | $2,000 | $45,858 |
| 2013 | -- | $47,858 | $2,000 | $45,858 |
Source: Public Records
Map
Nearby Homes
- 1211 Bellview Rd
- 1039 Old Cedartown Rd
- 1714 Cedartown Hwy
- 0 Pine Mountain Rd Unit 7662185
- 482 Pine Mountain Rd
- 0 Pine Mountain Rd Unit 10478395
- 0 Pine Mountain Rd Unit 7540784
- 740 Calloway Dr
- 1825 Calloway Path
- 2020 Old Cedartown Rd
- 1907 Old Cedartown Rd
- 93 Clay Rd
- 702 Calloway Dr
- 158 Woodsmoke Rd
- 332 Stringer Rd
- 18 Hillside Dr
- 1111 Old Collard Valley Rd
- 722 Prospect Rd
- 133 N Bellview Rd
- 197 Oak Hill Dr
- 1295 Bellview Rd
- 2330 N Bellview Rd
- 1346 Bellview Rd
- 1315 Bellview Rd
- 1231 Bellview Rd
- 1266 Bellview Rd
- 1370 Bellview Rd
- 1380 Bellview Rd
- 1355 Bellview Rd
- 1208 Bellview Rd
- 1221 Bellview Rd
- 1400 Bellview Rd
- 1390 Bellview Rd
- 21 Sheep Leg Rd Unit AB
- 21 Sheep Leg Rd
- 1615 Lowery Rd
- 2276 N Bellview Rd
- 1451 Bellview Rd
- 2260 N Bellview Rd
- 1450 Bellview Rd