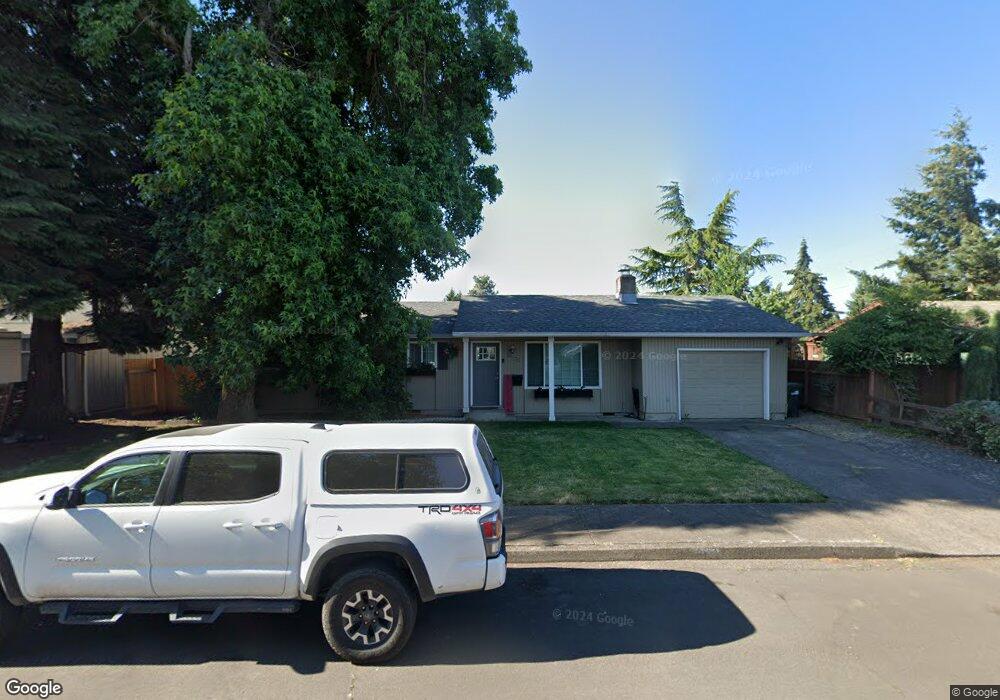
1293 Kenray Loop Springfield, OR 97477
Gateway NeighborhoodEstimated Value: $370,627 - $404,000
3
Beds
2
Baths
1,104
Sq Ft
$348/Sq Ft
Est. Value
About This Home
This home is located at 1293 Kenray Loop, Springfield, OR 97477 and is currently estimated at $384,407, approximately $348 per square foot. 1293 Kenray Loop is a home located in Lane County with nearby schools including Guy Lee Elementary School, Hamlin Middle School, and Springfield High School.
Ownership History
Date
Name
Owned For
Owner Type
Purchase Details
Closed on
Dec 28, 2016
Sold by
Ontime Property Investments Llc
Bought by
Pierson Scott A and Palomino Raquel M
Current Estimated Value
Home Financials for this Owner
Home Financials are based on the most recent Mortgage that was taken out on this home.
Original Mortgage
$211,105
Outstanding Balance
$171,222
Interest Rate
3.75%
Mortgage Type
FHA
Estimated Equity
$213,185
Purchase Details
Closed on
Aug 12, 2016
Sold by
Jarvis Christopher L and Jarvis Kaela R
Bought by
Ontime Property Investments Llc
Purchase Details
Closed on
Apr 30, 2012
Sold by
Ryan Robert Kevin and Ryan Marianne Elizabeth
Bought by
Jarvis Christopher L and Jarvis Kaela R
Home Financials for this Owner
Home Financials are based on the most recent Mortgage that was taken out on this home.
Original Mortgage
$117,600
Interest Rate
4.05%
Mortgage Type
New Conventional
Create a Home Valuation Report for This Property
The Home Valuation Report is an in-depth analysis detailing your home's value as well as a comparison with similar homes in the area
Home Values in the Area
Average Home Value in this Area
Purchase History
| Date | Buyer | Sale Price | Title Company |
|---|---|---|---|
| Pierson Scott A | $215,000 | Cascade Title Company | |
| Ontime Property Investments Llc | $130,000 | Fidelity Natl Title Co Of Or | |
| Jarvis Christopher L | $147,000 | Cascade Title Company |
Source: Public Records
Mortgage History
| Date | Status | Borrower | Loan Amount |
|---|---|---|---|
| Open | Pierson Scott A | $211,105 | |
| Previous Owner | Jarvis Christopher L | $117,600 |
Source: Public Records
Tax History
| Year | Tax Paid | Tax Assessment Tax Assessment Total Assessment is a certain percentage of the fair market value that is determined by local assessors to be the total taxable value of land and additions on the property. | Land | Improvement |
|---|---|---|---|---|
| 2025 | $3,245 | $176,961 | -- | -- |
| 2024 | $3,192 | $171,807 | -- | -- |
| 2023 | $3,192 | $166,803 | $0 | $0 |
| 2022 | $2,957 | $161,945 | $0 | $0 |
| 2021 | $2,904 | $157,229 | $0 | $0 |
| 2020 | $2,819 | $152,650 | $0 | $0 |
| 2019 | $2,734 | $148,204 | $0 | $0 |
| 2018 | $2,577 | $139,697 | $0 | $0 |
| 2017 | $2,478 | $139,697 | $0 | $0 |
| 2016 | $2,426 | $135,628 | $0 | $0 |
| 2015 | $2,357 | $131,678 | $0 | $0 |
| 2014 | $2,322 | $127,843 | $0 | $0 |
Source: Public Records
Map
Nearby Homes
- 446 Kodiak St
- 2727 Gateway St Unit 27
- 898 Lochaven Ave
- 3700 Babcock Ln Unit 119
- 3700 Babcock Ln Unit 106
- 2846 El Toro Ct
- 3579 Oxbow Way
- 825 Waverly St
- 1038 President St
- 1271 Arcadia Dr
- 484 Scotts Glen Dr
- 451 Lochaven Ave
- 485 Scotts Glen Dr
- 1270 Calvin St
- 3460 Oxbow Way
- 2150 Laura (#57) St Unit 57
- 2150 Laura St Unit 119
- 2150 Laura St Unit 111
- 2150 Laura St Unit 39
- 2150 Laura St Unit 57
- 1295 Kenray Loop
- 1291 Kenray Loop
- 1269 Kenray Loop
- 2412 Dornoch St
- 2410 Dornoch St
- 1287 Kenray Loop
- 1294 Kenray Loop
- 2386 Dornoch St
- 1292 Kenray Loop
- 1296 Kenray Loop
- 0 Kenray Loop
- 1271 Kenray Loop
- 1290 Kenray Loop
- 2356 Dornoch St
- 2442 Dornoch St
- 2440 Dornoch St
- 1264 Kenray Loop
- 1288 Kenray Loop
- 2340 Dornoch St
- 1260 Kenray Loop
Your Personal Tour Guide
Ask me questions while you tour the home.