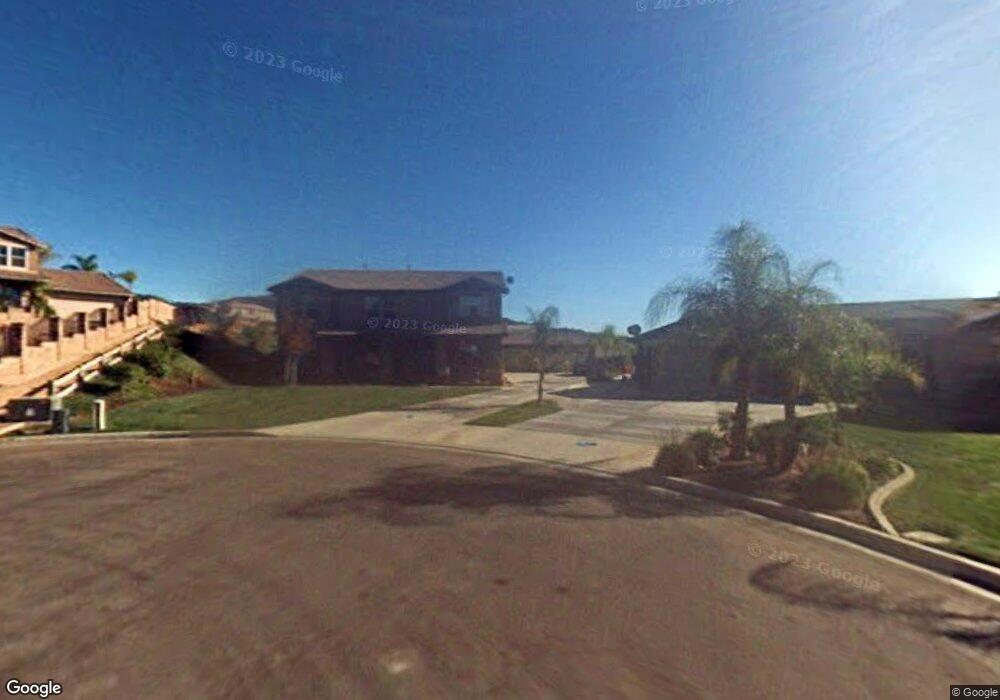
12931 Amber Ln Yucaipa, CA 92399
Estimated Value: $783,768 - $1,237,000
5
Beds
3
Baths
3,092
Sq Ft
$313/Sq Ft
Est. Value
About This Home
This home is located at 12931 Amber Ln, Yucaipa, CA 92399 and is currently estimated at $966,692, approximately $312 per square foot. 12931 Amber Ln is a home located in San Bernardino County with nearby schools including Wildwood Elementary School, Mesa View Middle School, and Yucaipa High School.
Ownership History
Date
Name
Owned For
Owner Type
Purchase Details
Closed on
Sep 24, 2013
Sold by
Capen Michelle Ann
Bought by
Capen Michelle and Michelle Capen Revocable Trust
Current Estimated Value
Purchase Details
Closed on
Dec 27, 2010
Sold by
Burke Michelle Ann
Bought by
Capen Michelle Ann
Home Financials for this Owner
Home Financials are based on the most recent Mortgage that was taken out on this home.
Original Mortgage
$212,500
Outstanding Balance
$6,492
Interest Rate
4.62%
Mortgage Type
New Conventional
Estimated Equity
$960,200
Purchase Details
Closed on
Dec 31, 2002
Sold by
Wildwood Canyon Llc
Bought by
Burke Edward T and Burke Michelle Ann
Home Financials for this Owner
Home Financials are based on the most recent Mortgage that was taken out on this home.
Original Mortgage
$278,950
Interest Rate
5.97%
Create a Home Valuation Report for This Property
The Home Valuation Report is an in-depth analysis detailing your home's value as well as a comparison with similar homes in the area
Home Values in the Area
Average Home Value in this Area
Purchase History
| Date | Buyer | Sale Price | Title Company |
|---|---|---|---|
| Capen Michelle | -- | None Available | |
| Capen Michelle Ann | -- | None Available | |
| Burke Edward T | $349,000 | Fidelity |
Source: Public Records
Mortgage History
| Date | Status | Borrower | Loan Amount |
|---|---|---|---|
| Open | Capen Michelle Ann | $212,500 | |
| Closed | Burke Edward T | $278,950 |
Source: Public Records
Tax History Compared to Growth
Tax History
| Year | Tax Paid | Tax Assessment Tax Assessment Total Assessment is a certain percentage of the fair market value that is determined by local assessors to be the total taxable value of land and additions on the property. | Land | Improvement |
|---|---|---|---|---|
| 2025 | $7,124 | $505,096 | $126,275 | $378,821 |
| 2024 | $7,124 | $495,192 | $123,799 | $371,393 |
| 2023 | $6,997 | $485,483 | $121,372 | $364,111 |
| 2022 | $6,875 | $475,964 | $118,992 | $356,972 |
| 2021 | $6,728 | $466,632 | $116,659 | $349,973 |
| 2020 | $6,751 | $461,847 | $115,463 | $346,384 |
| 2019 | $6,536 | $452,791 | $113,199 | $339,592 |
| 2018 | $6,147 | $443,912 | $110,979 | $332,933 |
| 2017 | $6,005 | $435,208 | $108,803 | $326,405 |
| 2016 | $5,911 | $426,675 | $106,670 | $320,005 |
| 2015 | $5,959 | $420,266 | $105,068 | $315,198 |
| 2014 | $5,852 | $412,034 | $103,010 | $309,024 |
Source: Public Records
Map
Nearby Homes
- 36254 Poplar Dr
- 34529 Wildwood Canyon Rd
- 0 Brookwood Ct
- 35885 Wildwood Crest Dr
- 35883 Wildwood Crest Dr
- 35879 Wildwood Crest Dr
- 35750 Brookwood Ct
- 35816 Wildwood Canyon Rd
- 36123 Serape Dr
- 35676 Lynfall St
- 35683 Wildwood Canyon Rd
- 36442 Wildwood Canyon Rd
- 12943 Lupine Ct
- 35550 Bella Vista Dr
- 35710 Avenue H
- 36698 Parkview Terrace
- 35476 Wildwood Canyon Rd
- 35645 Avenue E
- 36029 Leah Ln
- 35438 Cabrini Dr
- 12915 Amber Ln
- 12930 Amber Ln
- 0 Amber Ln
- 36074 Cherrywood Dr
- 36094 Cherrywood Dr
- 36058 Cherrywood Dr
- 12926 Amber Ln
- 36044 Cherrywood Dr
- 36110 Cherrywood Dr
- 12912 Amber Ln
- 36028 Cherrywood Dr
- 36126 Cherrywood Dr
- 36017 Bella Vista Dr
- 12879 Amber Ln
- 36016 Cherrywood Dr
- 36093 Cherrywood Dr
- 36073 Cherrywood Dr
- 36105 Cherrywood Dr
- 36057 Cherrywood Dr
- 36000 Cherrywood Dr