Estimated Value: $487,000 - $545,255
3
Beds
3
Baths
1,281
Sq Ft
$410/Sq Ft
Est. Value
About This Home
This home is located at 12941 Saddleback Place, Chino, CA 91710 and is currently estimated at $525,564, approximately $410 per square foot. 12941 Saddleback Place is a home located in San Bernardino County with nearby schools including Dickson Elementary, Ramona Junior High School, and Don Antonio Lugo High School.
Ownership History
Date
Name
Owned For
Owner Type
Purchase Details
Closed on
Jul 25, 2017
Sold by
Sqml Llc
Bought by
The Graciela Beatriz Quirino Living Trus
Current Estimated Value
Purchase Details
Closed on
Mar 5, 2016
Sold by
Quirino Graciela Beatriz
Bought by
Gqml Llc
Purchase Details
Closed on
Aug 19, 1999
Sold by
Hud
Bought by
Quirino Graciela B and Lospennato Marisa
Home Financials for this Owner
Home Financials are based on the most recent Mortgage that was taken out on this home.
Original Mortgage
$84,306
Interest Rate
7.86%
Mortgage Type
FHA
Purchase Details
Closed on
Feb 24, 1999
Sold by
Nationsbanc Mtg Corp
Bought by
Hud
Purchase Details
Closed on
Jul 30, 1998
Sold by
Akintunde Adebayo and Akintunde Ruth
Bought by
Nationsbanc Mtg Corp
Create a Home Valuation Report for This Property
The Home Valuation Report is an in-depth analysis detailing your home's value as well as a comparison with similar homes in the area
Home Values in the Area
Average Home Value in this Area
Purchase History
| Date | Buyer | Sale Price | Title Company |
|---|---|---|---|
| The Graciela Beatriz Quirino Living Trus | -- | None Available | |
| Gqml Llc | -- | None Available | |
| Quirino Graciela B | $85,000 | First Southwestern Title Co | |
| Hud | -- | Fidelity National Title Ins | |
| Nationsbanc Mtg Corp | $97,051 | Fidelity National Title Ins |
Source: Public Records
Mortgage History
| Date | Status | Borrower | Loan Amount |
|---|---|---|---|
| Previous Owner | Quirino Graciela B | $84,306 |
Source: Public Records
Tax History Compared to Growth
Tax History
| Year | Tax Paid | Tax Assessment Tax Assessment Total Assessment is a certain percentage of the fair market value that is determined by local assessors to be the total taxable value of land and additions on the property. | Land | Improvement |
|---|---|---|---|---|
| 2025 | $3,961 | $364,107 | $127,438 | $236,669 |
| 2024 | $3,961 | $356,967 | $124,939 | $232,028 |
| 2023 | $3,851 | $349,967 | $122,489 | $227,478 |
| 2022 | $3,829 | $343,105 | $120,087 | $223,018 |
| 2021 | $3,754 | $336,377 | $117,732 | $218,645 |
| 2020 | $3,706 | $332,928 | $116,525 | $216,403 |
| 2019 | $3,641 | $326,400 | $114,240 | $212,160 |
| 2018 | $3,561 | $320,000 | $112,000 | $208,000 |
| 2017 | $3,243 | $290,700 | $102,000 | $188,700 |
| 2016 | $1,191 | $110,360 | $32,459 | $77,901 |
| 2015 | $1,168 | $108,702 | $31,971 | $76,731 |
| 2014 | $1,145 | $106,573 | $31,345 | $75,228 |
Source: Public Records
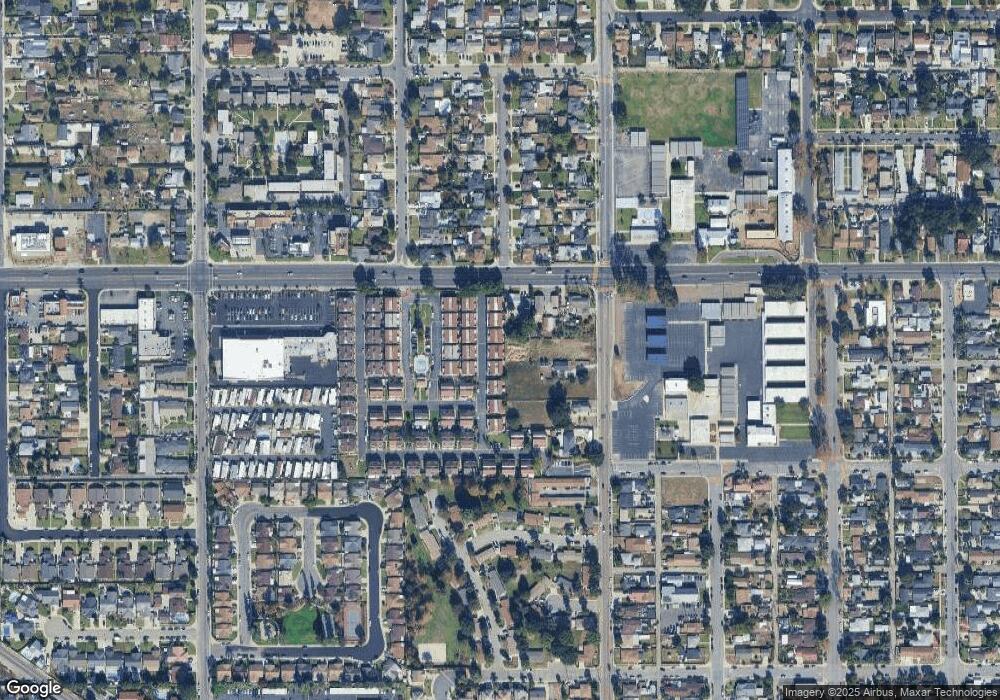
Map
Nearby Homes
- 13115 Monte Vista Ave
- 13066 3rd St
- 13123 2nd St
- 13116 3rd St
- 12940 4th St
- 4862 Lincoln Ave
- 12939 5th St
- 13257 2nd St
- 12686 3rd St
- 4539 Carmen St
- 4621 Chino Ave
- 4449 Carmen St
- 4440 Carmen St
- 4912 G St
- 12958 Boston Ave
- 12635 Franklin Ct Unit 8b
- 13401 Wisteria Place
- 12801 Norton Ave
- 12540 Ramona Ave
- 0 C St
- 12947 Saddleback Place
- 12955 Saddleback Place
- 12961 Saddleback Place
- 12935 Saddleback Place Unit 54
- 12929 Saddleback Place
- 12942 Saddleback Place
- 12954 Saddleback Place
- 12965 Saddleback Place
- 12936 Saddleback Place
- 12960 Saddleback Place
- 12923 Saddleback Place
- 12930 Saddleback Place
- 12969 Saddleback Place
- 12917 Saddleback Place
- 12917 Saddleback Plaza
- 4838 Ranch Rd
- 12924 Saddleback Place
- 12945 Royal Palm Cir
- 12939 Royal Palm Cir
- 4834 Ranch Rd