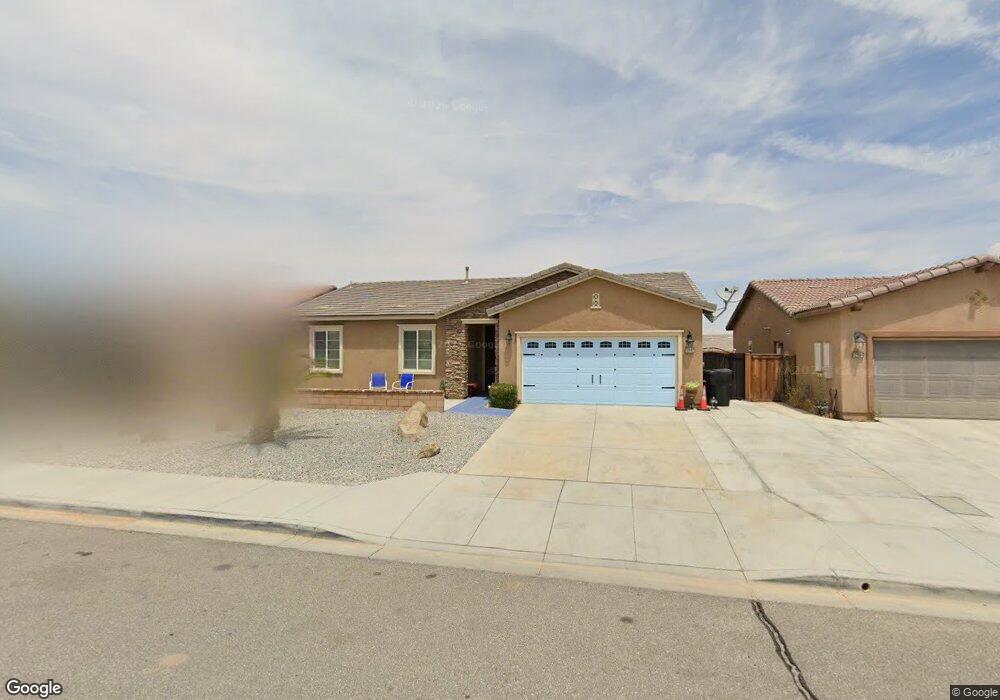
12942 Los Picaros Ln Victorville, CA 92394
Mesa Linda NeighborhoodEstimated Value: $364,000 - $378,000
3
Beds
2
Baths
1,331
Sq Ft
$279/Sq Ft
Est. Value
About This Home
This home is located at 12942 Los Picaros Ln, Victorville, CA 92394 and is currently estimated at $371,572, approximately $279 per square foot. 12942 Los Picaros Ln is a home located in San Bernardino County with nearby schools including West Creek Elementary School and Adelanto High School.
Ownership History
Date
Name
Owned For
Owner Type
Purchase Details
Closed on
Nov 15, 2011
Sold by
Devaughn Harrison James
Bought by
Moore Devaughn Harrison James and Moore De Vaughn Elaine
Current Estimated Value
Purchase Details
Closed on
Nov 11, 2010
Sold by
Devaughn Elaine Moore
Bought by
Devaughn Harrison James
Home Financials for this Owner
Home Financials are based on the most recent Mortgage that was taken out on this home.
Original Mortgage
$126,694
Outstanding Balance
$84,240
Interest Rate
4.5%
Mortgage Type
FHA
Estimated Equity
$287,332
Purchase Details
Closed on
Oct 13, 2010
Sold by
D R Horton Los Angeles Holding Inc
Bought by
Devaughn Harrison James
Home Financials for this Owner
Home Financials are based on the most recent Mortgage that was taken out on this home.
Original Mortgage
$126,694
Outstanding Balance
$84,240
Interest Rate
4.5%
Mortgage Type
FHA
Estimated Equity
$287,332
Create a Home Valuation Report for This Property
The Home Valuation Report is an in-depth analysis detailing your home's value as well as a comparison with similar homes in the area
Home Values in the Area
Average Home Value in this Area
Purchase History
| Date | Buyer | Sale Price | Title Company |
|---|---|---|---|
| Moore Devaughn Harrison James | -- | None Available | |
| Devaughn Harrison James | -- | Lawyers Title | |
| Devaughn Harrison James | $134,545 | Lawyers Title |
Source: Public Records
Mortgage History
| Date | Status | Borrower | Loan Amount |
|---|---|---|---|
| Open | Devaughn Harrison James | $126,694 |
Source: Public Records
Tax History Compared to Growth
Tax History
| Year | Tax Paid | Tax Assessment Tax Assessment Total Assessment is a certain percentage of the fair market value that is determined by local assessors to be the total taxable value of land and additions on the property. | Land | Improvement |
|---|---|---|---|---|
| 2025 | $3,831 | $166,541 | $16,655 | $149,886 |
| 2024 | $3,831 | $163,275 | $16,328 | $146,947 |
| 2023 | $3,769 | $160,074 | $16,008 | $144,066 |
| 2022 | $3,707 | $156,935 | $15,694 | $141,241 |
| 2021 | $3,775 | $153,858 | $15,386 | $138,472 |
| 2020 | $3,708 | $152,280 | $15,228 | $137,052 |
| 2019 | $3,661 | $149,294 | $14,929 | $134,365 |
| 2018 | $3,680 | $146,366 | $14,636 | $131,730 |
| 2017 | $3,594 | $143,496 | $14,349 | $129,147 |
| 2016 | $3,538 | $140,683 | $14,068 | $126,615 |
| 2015 | $3,414 | $138,570 | $13,857 | $124,713 |
| 2014 | $3,406 | $135,856 | $13,586 | $122,270 |
Source: Public Records
Map
Nearby Homes
- 15089 Mateo Prado Way
- 13023 Camino de Oro Place
- 0 Diamond Rd
- 14926 Onyx Rd
- 0 Seneca Rd Unit IG25249807
- 13108 Solar Bay Ln
- 15165 Bluffside Ln
- 15150 Onyx Rd
- 14991 Mandalay Ln
- 15134 Paseo Verde Place
- 0 Seneca Rd Unit CV24147838
- 0 Seneca Rd Unit DW25026716
- 14964 Butler Peak Ct
- 15522 San Francisco Ln
- 0 Mojave Dr Unit HD25223831
- 0 Mojave Dr Unit HD22167503
- 0 Mojave Dr Unit PW24119742
- 0 Mojave Dr Unit PW23030279
- 0 Seneca Unit IV25143158
- 0 Seneca Unit HD22185525
- 12954 Los Picaros Ln
- 12938 Los Picaros Ln
- 12966 Los Picaros Ln
- 12945 San Felipe St
- 12957 San Felipe St
- 12933 San Felipe St
- 12969 San Felipe St
- 12943 Los Picaros Ln
- 12978 Los Picaros Ln
- 12955 Los Picaros Ln
- 12939 Los Picaros Ln
- 12967 Los Picaros Ln
- 14962 Mateo Prado Way
- 12973 San Felipe St
- 14958 Mateo Prado Way
- 14946 Mateo Prado Way
- 12979 Los Picaros Ln
- 14986 Mateo Prado Way
- 14934 Mateo Prado Way
- 14917 Mateo Prado Way