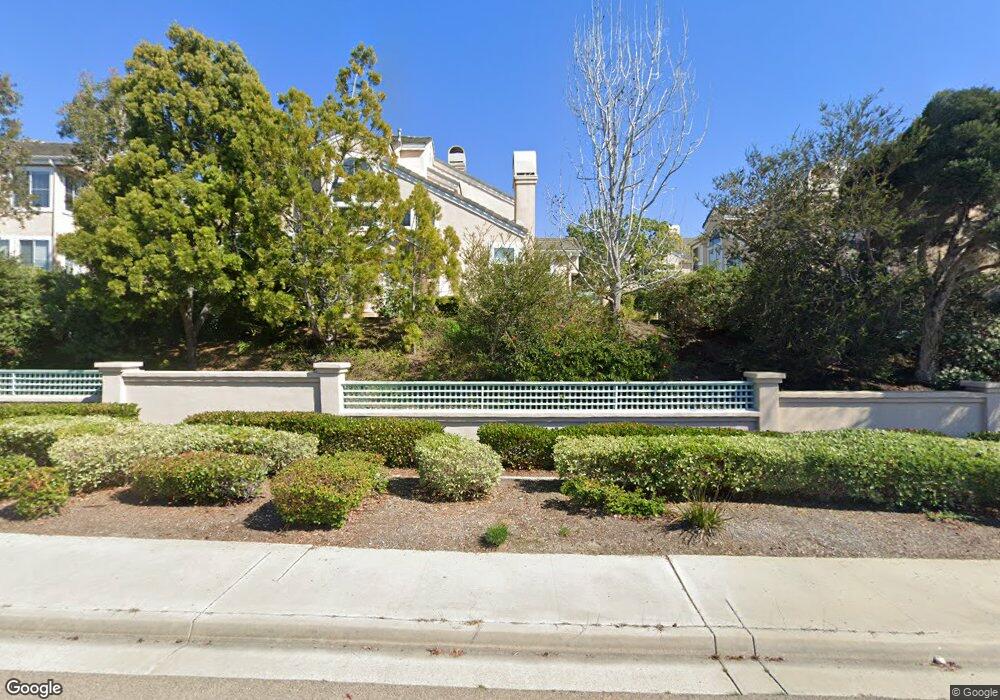
12944 Carmel Creek Rd Unit 93 San Diego, CA 92130
Carmel Valley NeighborhoodEstimated Value: $1,020,000 - $1,035,000
2
Beds
3
Baths
1,316
Sq Ft
$780/Sq Ft
Est. Value
About This Home
This home is located at 12944 Carmel Creek Rd Unit 93, San Diego, CA 92130 and is currently estimated at $1,026,500, approximately $780 per square foot. 12944 Carmel Creek Rd Unit 93 is a home located in San Diego County with nearby schools including Carmel Creek Elementary School, Solana Pacific Elementary School, and Carmel Valley Middle School.
Ownership History
Date
Name
Owned For
Owner Type
Purchase Details
Closed on
Oct 7, 2016
Sold by
Adams Linda P
Bought by
Linggi Deborah
Current Estimated Value
Home Financials for this Owner
Home Financials are based on the most recent Mortgage that was taken out on this home.
Original Mortgage
$417,000
Outstanding Balance
$334,516
Interest Rate
3.48%
Mortgage Type
New Conventional
Estimated Equity
$691,984
Purchase Details
Closed on
Apr 16, 2007
Sold by
Parker Linda E
Bought by
Adams Linda P
Purchase Details
Closed on
May 22, 1997
Sold by
Kaprelian Martin V
Bought by
Parker Linda E
Home Financials for this Owner
Home Financials are based on the most recent Mortgage that was taken out on this home.
Original Mortgage
$138,400
Interest Rate
7.91%
Mortgage Type
Purchase Money Mortgage
Purchase Details
Closed on
Nov 10, 1988
Create a Home Valuation Report for This Property
The Home Valuation Report is an in-depth analysis detailing your home's value as well as a comparison with similar homes in the area
Home Values in the Area
Average Home Value in this Area
Purchase History
| Date | Buyer | Sale Price | Title Company |
|---|---|---|---|
| Linggi Deborah | $564,000 | First American Title Company | |
| Adams Linda P | -- | None Available | |
| Parker Linda E | -- | Southland Title | |
| -- | $153,300 | -- |
Source: Public Records
Mortgage History
| Date | Status | Borrower | Loan Amount |
|---|---|---|---|
| Open | Linggi Deborah | $417,000 | |
| Previous Owner | Parker Linda E | $138,400 |
Source: Public Records
Tax History Compared to Growth
Tax History
| Year | Tax Paid | Tax Assessment Tax Assessment Total Assessment is a certain percentage of the fair market value that is determined by local assessors to be the total taxable value of land and additions on the property. | Land | Improvement |
|---|---|---|---|---|
| 2025 | $7,128 | $654,561 | $299,463 | $355,098 |
| 2024 | $7,128 | $641,728 | $293,592 | $348,136 |
| 2023 | $6,963 | $629,146 | $287,836 | $341,310 |
| 2022 | $6,829 | $616,811 | $282,193 | $334,618 |
| 2021 | $6,713 | $604,717 | $276,660 | $328,057 |
| 2020 | $6,656 | $598,518 | $273,824 | $324,694 |
| 2019 | $6,532 | $586,783 | $268,455 | $318,328 |
| 2018 | $6,412 | $575,279 | $263,192 | $312,087 |
| 2017 | $6,306 | $564,000 | $258,032 | $305,968 |
| 2016 | $2,765 | $238,000 | $108,886 | $129,114 |
| 2015 | $2,728 | $234,426 | $107,251 | $127,175 |
| 2014 | $2,678 | $229,835 | $105,151 | $124,684 |
Source: Public Records
Map
Nearby Homes
- 12936 Carmel Creek Rd Unit 63
- 12620 Carmel Country Rd Unit 74
- 12364 Carmel Country Rd Unit C306
- 3877 Pell Place Unit 424
- 3877 Pell Place Unit 225
- 3857 Pell Place Unit 406
- 12370 Carmel Country Rd Unit 202
- 12372 Carmel Country Rd Unit 207
- 12372 Carmel Country Rd Unit 202
- 4271 Corte Favor
- 4436 Heritage Glen Ln
- 4049 Carmel View Rd Unit 74
- 4049 Carmel View Rd Unit 75
- 12550 Carmel Creek Rd Unit 100
- 3856 Quarter Mile Dr
- 12585 Ruette Alliante Unit 152
- 3606 Bernwood Place Unit 14
- 3936 Ambervale Terrace
- 12540 Caminito Mira Del Mar
- 3537 Caminito el Rincon Unit 259
- 12952 Carmel Creek Rd
- 12952 Carmel Creek Rd Unit 120
- 12952 Carmel Creek Rd Unit 119
- 12952 Carmel Creek Rd Unit 118
- 12952 Carmel Creek Rd Unit 117
- 12952 Carmel Creek Rd Unit 116
- 12950 Carmel Creek Rd Unit 105
- 12950 Carmel Creek Rd Unit 104
- 12950 Carmel Creek Rd Unit 103
- 12950 Carmel Creek Rd Unit 102
- 12950 Carmel Creek Rd Unit 101
- 12944 Carmel Creek Rd Unit 95
- 12944 Carmel Creek Rd Unit 94
- 12944 Carmel Creek Rd Unit 92
- 12908 Carmel Creek Rd Unit 86
- 12908 Carmel Creek Rd Unit 85
- 12908 Carmel Creek Rd Unit 84
- 12908 Carmel Creek Rd Unit 83
- 12908 Carmel Creek Rd Unit 82
- 12938 Carmel Creek Rd Unit 81