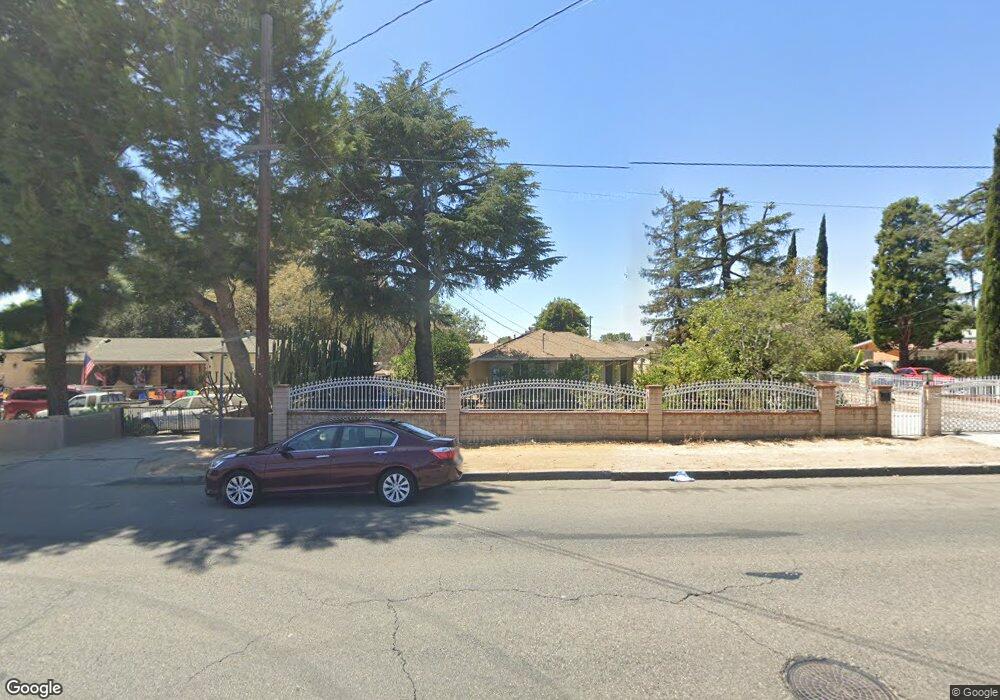
12945 Glenoaks Blvd Sylmar, CA 91342
Estimated Value: $798,000 - $1,047,000
6
Beds
2
Baths
2,327
Sq Ft
$397/Sq Ft
Est. Value
About This Home
This home is located at 12945 Glenoaks Blvd, Sylmar, CA 91342 and is currently estimated at $924,465, approximately $397 per square foot. 12945 Glenoaks Blvd is a home located in Los Angeles County with nearby schools including Sylmar Elementary School, Olive Vista Middle School, and San Fernando Senior High School.
Ownership History
Date
Name
Owned For
Owner Type
Purchase Details
Closed on
Dec 18, 1995
Sold by
Grant Miriam B
Bought by
Bugarin Jeronimo and Bugarin Anita
Current Estimated Value
Home Financials for this Owner
Home Financials are based on the most recent Mortgage that was taken out on this home.
Original Mortgage
$108,750
Outstanding Balance
$1,039
Interest Rate
4.05%
Estimated Equity
$923,426
Create a Home Valuation Report for This Property
The Home Valuation Report is an in-depth analysis detailing your home's value as well as a comparison with similar homes in the area
Home Values in the Area
Average Home Value in this Area
Purchase History
| Date | Buyer | Sale Price | Title Company |
|---|---|---|---|
| Bugarin Jeronimo | $145,000 | Chicago Title Co |
Source: Public Records
Mortgage History
| Date | Status | Borrower | Loan Amount |
|---|---|---|---|
| Open | Bugarin Jeronimo | $108,750 |
Source: Public Records
Tax History Compared to Growth
Tax History
| Year | Tax Paid | Tax Assessment Tax Assessment Total Assessment is a certain percentage of the fair market value that is determined by local assessors to be the total taxable value of land and additions on the property. | Land | Improvement |
|---|---|---|---|---|
| 2025 | $4,380 | $330,330 | $86,703 | $243,627 |
| 2024 | $4,380 | $323,853 | $85,003 | $238,850 |
| 2023 | $4,303 | $317,504 | $83,337 | $234,167 |
| 2022 | $4,116 | $311,279 | $81,703 | $229,576 |
| 2021 | $4,057 | $305,176 | $80,101 | $225,075 |
| 2020 | $4,092 | $302,048 | $79,280 | $222,768 |
| 2019 | $3,944 | $296,126 | $77,726 | $218,400 |
| 2018 | $3,716 | $290,320 | $76,202 | $214,118 |
| 2016 | $3,531 | $279,048 | $73,244 | $205,804 |
| 2015 | $3,481 | $274,857 | $72,144 | $202,713 |
| 2014 | $3,501 | $269,474 | $70,731 | $198,743 |
Source: Public Records
Map
Nearby Homes
- 14529 Paddock St
- 13007 Glenoaks Blvd
- 13016 Jamie Ave
- 14365 Berg St
- 13108 Fellows Ave
- 14594 Lyle St
- 15235 152351/2 Nurmi St
- 12796 Norris Ave
- 14758 Lakeside St
- 13009 Herrick Ave
- 12867 Norris Ave
- 14785 Polk St
- 14840 Polk St
- 14401 Lakeside St
- 12563 Bradley Ave Unit 13
- 12642 Ralston Ave Unit 1
- 14073 Aztec St
- 14761 Astoria St
- 14052 Aztec St
- 12603 Ralston Ave
- 12955 Glenoaks Blvd
- 12910 De Haven Ave
- 12933 Glenoaks Blvd
- 12959 Glenoaks Blvd
- 12914 De Haven Ave
- 12927 Glenoaks Blvd
- 12963 Glenoaks Blvd
- 12920 De Haven Ave
- 12967 Glenoaks Blvd
- 12901 De Haven Ave
- 12924 De Haven Ave
- 12907 De Haven Ave
- 12923 Glenoaks Blvd
- 12911 De Haven Ave
- 14408 Oro Grande St
- 12915 De Haven Ave
- 12950 Glenoaks Blvd
- 12975 Glenoaks Blvd
- 12930 De Haven Ave
- 12921 De Haven Ave