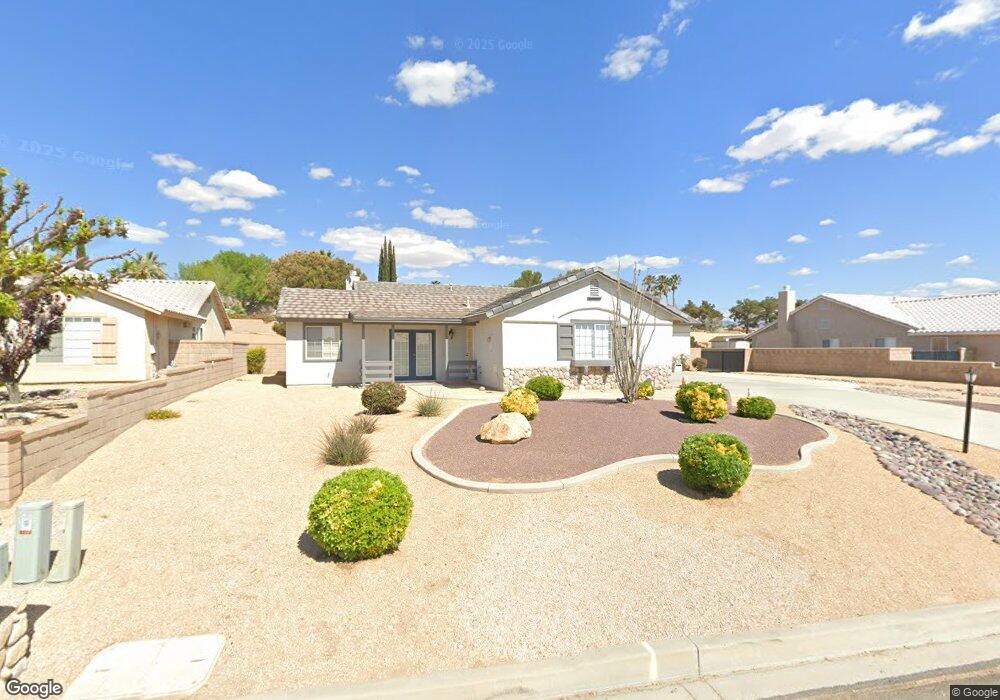
12947 Tawya Rd Apple Valley, CA 92308
High Desert NeighborhoodEstimated Value: $524,393 - $616,000
4
Beds
3
Baths
2,694
Sq Ft
$215/Sq Ft
Est. Value
About This Home
This home is located at 12947 Tawya Rd, Apple Valley, CA 92308 and is currently estimated at $578,098, approximately $214 per square foot. 12947 Tawya Rd is a home located in San Bernardino County with nearby schools including Sitting Bull Academy, Apple Valley High School, and Excelsior Charter School.
Ownership History
Date
Name
Owned For
Owner Type
Purchase Details
Closed on
Sep 29, 2011
Sold by
Moore Rayna and Lenning Family Trust
Bought by
Goeson Randy L and Goeson Lisa K
Current Estimated Value
Home Financials for this Owner
Home Financials are based on the most recent Mortgage that was taken out on this home.
Original Mortgage
$164,000
Outstanding Balance
$111,584
Interest Rate
4.05%
Mortgage Type
New Conventional
Estimated Equity
$466,514
Purchase Details
Closed on
Sep 13, 1999
Sold by
Lenning Ray D and Lenning Edna L
Bought by
Lenning Ray David and Lenning Edna Loura
Purchase Details
Closed on
Oct 20, 1997
Sold by
Clearview Llc
Bought by
Lenning Ray D and Lenning Edna L
Home Financials for this Owner
Home Financials are based on the most recent Mortgage that was taken out on this home.
Original Mortgage
$73,790
Interest Rate
6.95%
Create a Home Valuation Report for This Property
The Home Valuation Report is an in-depth analysis detailing your home's value as well as a comparison with similar homes in the area
Home Values in the Area
Average Home Value in this Area
Purchase History
| Date | Buyer | Sale Price | Title Company |
|---|---|---|---|
| Goeson Randy L | $205,000 | Fnt Ie | |
| Lenning Ray David | -- | -- | |
| Lenning Ray D | $147,000 | Chicago Title Co |
Source: Public Records
Mortgage History
| Date | Status | Borrower | Loan Amount |
|---|---|---|---|
| Open | Goeson Randy L | $164,000 | |
| Previous Owner | Lenning Ray D | $73,790 |
Source: Public Records
Tax History
| Year | Tax Paid | Tax Assessment Tax Assessment Total Assessment is a certain percentage of the fair market value that is determined by local assessors to be the total taxable value of land and additions on the property. | Land | Improvement |
|---|---|---|---|---|
| 2025 | $3,140 | $257,492 | $77,248 | $180,244 |
| 2024 | $3,055 | $252,443 | $75,733 | $176,710 |
| 2023 | $3,026 | $247,493 | $74,248 | $173,245 |
| 2022 | $2,981 | $242,640 | $72,792 | $169,848 |
| 2021 | $2,915 | $237,883 | $71,365 | $166,518 |
| 2020 | $2,881 | $235,444 | $70,633 | $164,811 |
| 2019 | $2,829 | $230,827 | $69,248 | $161,579 |
| 2018 | $2,761 | $226,301 | $67,890 | $158,411 |
| 2017 | $2,724 | $221,864 | $66,559 | $155,305 |
| 2016 | $2,621 | $217,514 | $65,254 | $152,260 |
| 2015 | $2,657 | $214,247 | $64,274 | $149,973 |
| 2014 | $2,623 | $210,050 | $63,015 | $147,035 |
Source: Public Records
Map
Nearby Homes
- 23766 Valley View Ct
- 13167 Olathe Rd
- 13114 Choco Rd
- 12971 Lompoc Rd
- 13288 Choco Rd
- 20190 Osseo Rd
- 20219 Osseo Rd
- 13311 Choco Rd
- 20136 Ottawa Rd
- 19978 Eyota Rd
- 12925 Davona Dale Rd
- 13027 Quapaw Rd
- 19783 Lara Ln
- 13519 Sunset Dr
- 12902 Casco Rd
- 13195 Trailwood Way
- 19274 Kanbridge St
- 19265 Kanbridge St
- 12574 Sarsi Ct
- 12720 Yorkshire Dr
- 12931 Tawya Rd
- 12971 Tawya Rd
- 12915 Tawya Rd
- 12985 Tawya Rd
- 12936 Valley View Ct
- 12946 Tawya Rd
- 12958 Valley View Ct
- 12970 Tawya Rd
- 12970 Valley View Ct
- 12984 Tawya Rd
- 12997 Tawya Rd
- 12914 Valley View Ct
- 12914 Valley View (Bonus) Ct
- 12996 Tawya Rd
- 12992 Valley View Ct
- 0 Valley View Ct
- 19799 Modoc Rd
- 4 Valley View Ct
- 19889 Modoc Rd
- 12927 Choco Rd
Your Personal Tour Guide
Ask me questions while you tour the home.