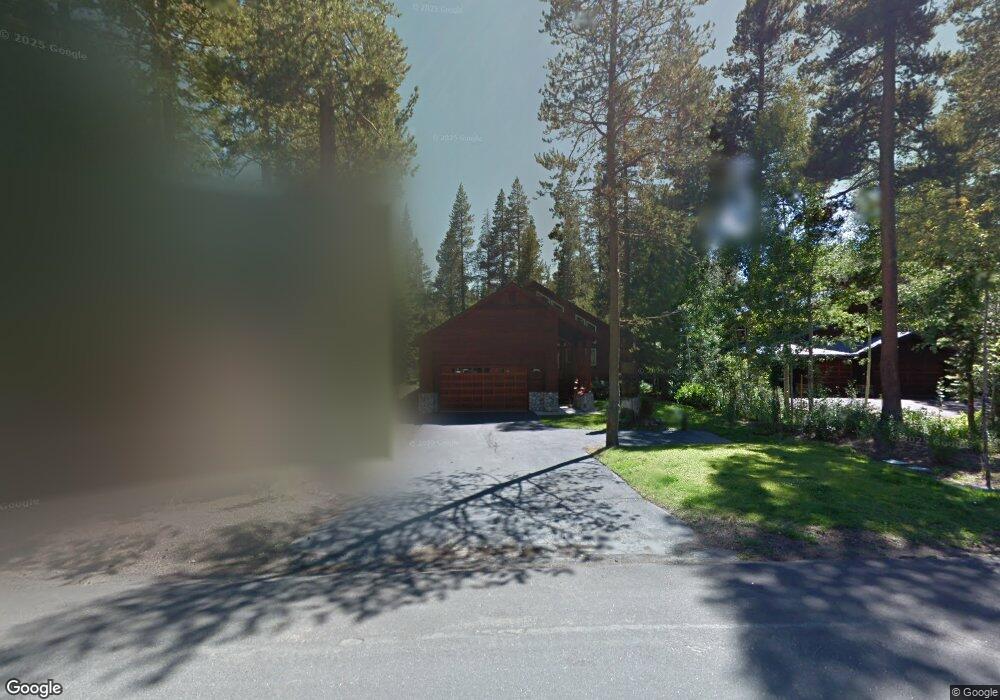
12948 Ski View Loop Truckee, CA 96161
Tahoe Donner NeighborhoodEstimated Value: $1,370,000 - $1,519,000
3
Beds
4
Baths
2,363
Sq Ft
$601/Sq Ft
Est. Value
About This Home
This home is located at 12948 Ski View Loop, Truckee, CA 96161 and is currently estimated at $1,420,904, approximately $601 per square foot. 12948 Ski View Loop is a home located in Nevada County with nearby schools including Truckee Elementary School, Alder Creek Middle School, and Tahoe Truckee High School.
Ownership History
Date
Name
Owned For
Owner Type
Purchase Details
Closed on
Aug 3, 2016
Sold by
Brienzo Michael R
Bought by
Revocab Brienzo Michael R
Current Estimated Value
Purchase Details
Closed on
Sep 3, 2014
Sold by
Revoc Lischwe Deborah G
Bought by
Brienzo Michael R and Brienzo Rachel C
Purchase Details
Closed on
Sep 18, 2007
Sold by
Brienzo Christine G
Bought by
Revoc Brienzo Christine G
Purchase Details
Closed on
Sep 7, 2007
Sold by
Brienzo Frank L
Bought by
Brienzo Christine G
Purchase Details
Closed on
Aug 27, 2007
Sold by
Brienzo Frank L and Brienzo Christine G
Bought by
Brienzo Frank L and Brienzo Christine G
Purchase Details
Closed on
Sep 19, 2001
Sold by
Drown Willard N and Drown Susan
Bought by
Brienzo Frank L and Brienzo Christine G
Purchase Details
Closed on
Jan 25, 1999
Sold by
Schwendinger Richard L and Schwendinger P A
Bought by
Drown Willard N and Drown Susan
Create a Home Valuation Report for This Property
The Home Valuation Report is an in-depth analysis detailing your home's value as well as a comparison with similar homes in the area
Home Values in the Area
Average Home Value in this Area
Purchase History
| Date | Buyer | Sale Price | Title Company |
|---|---|---|---|
| Revocab Brienzo Michael R | -- | None Available | |
| Revocabl Brienzo Rachel C | -- | None Available | |
| Brienzo Michael R | -- | None Available | |
| Revoc Brienzo Christine G | -- | None Available | |
| Brienzo Christine G | -- | None Available | |
| Brienzo Frank L | -- | None Available | |
| Brienzo Frank L | $760,000 | First American Title Ins Co | |
| Drown Willard N | $87,500 | California Land Title Co |
Source: Public Records
Tax History
| Year | Tax Paid | Tax Assessment Tax Assessment Total Assessment is a certain percentage of the fair market value that is determined by local assessors to be the total taxable value of land and additions on the property. | Land | Improvement |
|---|---|---|---|---|
| 2025 | $13,370 | $1,125,639 | $335,291 | $790,348 |
| 2024 | $13,281 | $1,103,568 | $328,717 | $774,851 |
| 2023 | $13,281 | $1,081,930 | $322,272 | $759,658 |
| 2022 | $12,966 | $1,060,716 | $315,953 | $744,763 |
| 2021 | $12,454 | $1,039,859 | $309,699 | $730,160 |
| 2020 | $12,382 | $1,029,198 | $306,524 | $722,674 |
| 2019 | $12,416 | $1,009,018 | $300,514 | $708,504 |
| 2018 | $11,670 | $989,234 | $294,622 | $694,612 |
| 2017 | $11,443 | $969,842 | $288,849 | $680,993 |
| 2016 | $11,361 | $950,140 | $282,499 | $667,641 |
| 2015 | $11,100 | $935,871 | $278,258 | $657,613 |
| 2014 | $11,100 | $917,541 | $272,809 | $644,732 |
Source: Public Records
Map
Nearby Homes
- 14258 Glacier View Dr
- 13938 Northwoods Blvd
- 14579 Northwoods Blvd
- 13854 Northwoods Blvd
- 14653 Northwoods Blvd
- 11926 Rhineland Ave
- 13257 Ski Slope Way
- 13420 Northwoods Blvd
- 13038 Ski Slope Way
- 14487 Ski Slope Way
- 11711 Snowpeak Way Unit 555
- 11723 Snowpeak Way Unit 567
- 16725 Ski Slope Way Unit 5
- 13239 Northwoods Blvd Unit B
- 11591 Snowpeak Way Unit 407
- 13205 Northwoods Blvd Unit 2
- 11566 Rhineland Ave
- 12465 Bear Meadows Ct Unit 3
- 12574 Saint Moritz Ln
- 12621 Peregrine Dr
- 12962 Ski View Loop
- 12934 Ski View Loop
- 12976 Ski View Loop
- 12924 Ski View Loop
- 12990 Ski View Loop
- 12935 Ski View Loop
- 12935 Ski View Loop Unit 11
- 12949 Ski View Loop Unit 11
- 12963 Skiview Loop
- 12912 Ski View Loop
- 13004 Ski View Loop
- 12903 Skiview Loop
- 12977 Skiview Loop
- 12991 Skiview Loop
- 13018 Ski View Loop
- 12865 Ski View Loop
- 13005 Ski View Loop
- 13034 Ski View Loop
- 12890 Ski View Loop
- 13017 Ski View Loop
Your Personal Tour Guide
Ask me questions while you tour the home.