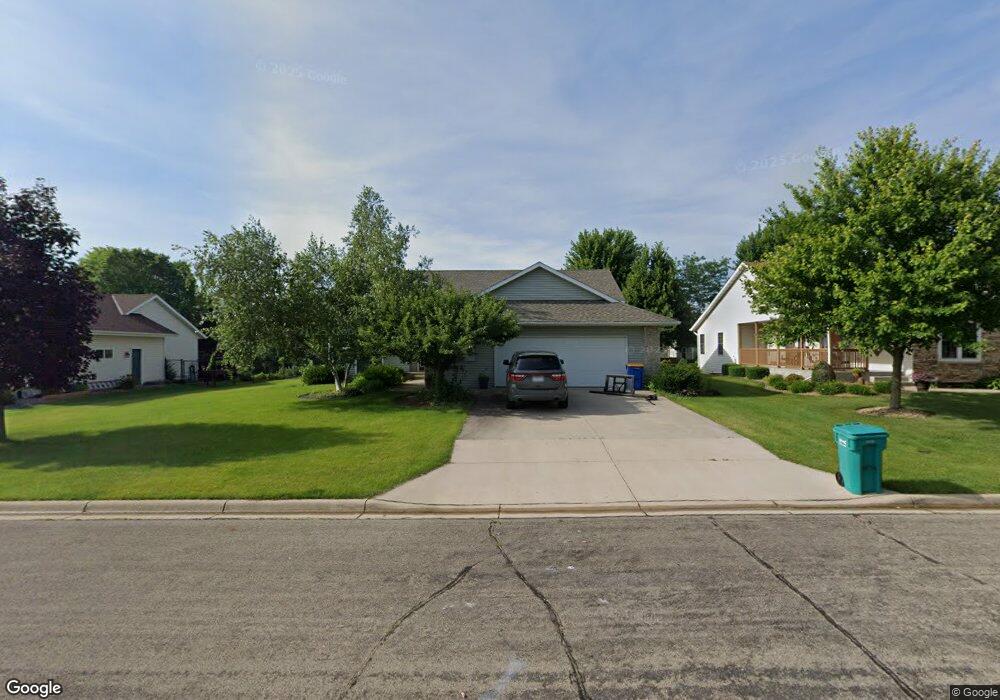
1295 12th St SE Owatonna, MN 55060
Estimated Value: $376,291 - $410,000
5
Beds
4
Baths
1,625
Sq Ft
$241/Sq Ft
Est. Value
About This Home
This home is located at 1295 12th St SE, Owatonna, MN 55060 and is currently estimated at $391,573, approximately $240 per square foot. 1295 12th St SE is a home located in Steele County with nearby schools including Lincoln Elementary School, Owatonna Middle School, and Owatonna Senior High School.
Ownership History
Date
Name
Owned For
Owner Type
Purchase Details
Closed on
Aug 8, 2008
Sold by
Warner Jay B and Warner Karin E
Bought by
Alvarez Roxana
Current Estimated Value
Home Financials for this Owner
Home Financials are based on the most recent Mortgage that was taken out on this home.
Original Mortgage
$209,611
Outstanding Balance
$138,783
Interest Rate
6.51%
Mortgage Type
FHA
Estimated Equity
$252,790
Purchase Details
Closed on
Jan 28, 2005
Sold by
Partners
Bought by
Warner Jay B and Warner Karin
Home Financials for this Owner
Home Financials are based on the most recent Mortgage that was taken out on this home.
Original Mortgage
$34,385
Interest Rate
5.83%
Mortgage Type
Stand Alone Second
Purchase Details
Closed on
Jan 24, 2005
Sold by
Horecka Gregory J and Horecka Judy M
Bought by
Partners
Home Financials for this Owner
Home Financials are based on the most recent Mortgage that was taken out on this home.
Original Mortgage
$34,385
Interest Rate
5.83%
Mortgage Type
Stand Alone Second
Create a Home Valuation Report for This Property
The Home Valuation Report is an in-depth analysis detailing your home's value as well as a comparison with similar homes in the area
Home Values in the Area
Average Home Value in this Area
Purchase History
| Date | Buyer | Sale Price | Title Company |
|---|---|---|---|
| Alvarez Roxana | $212,378 | Affinity Title | |
| Warner Jay B | $229,233 | Title Protection Inc | |
| Partners | -- | None Available |
Source: Public Records
Mortgage History
| Date | Status | Borrower | Loan Amount |
|---|---|---|---|
| Open | Alvarez Roxana | $209,611 | |
| Previous Owner | Warner Jay B | $34,385 | |
| Previous Owner | Warner Jay B | $183,387 |
Source: Public Records
Tax History Compared to Growth
Tax History
| Year | Tax Paid | Tax Assessment Tax Assessment Total Assessment is a certain percentage of the fair market value that is determined by local assessors to be the total taxable value of land and additions on the property. | Land | Improvement |
|---|---|---|---|---|
| 2025 | $5,134 | $362,500 | $57,900 | $304,600 |
| 2024 | $5,156 | $355,500 | $57,900 | $297,600 |
| 2023 | $5,130 | $347,000 | $49,000 | $298,000 |
| 2022 | $4,568 | $328,900 | $46,700 | $282,200 |
| 2021 | $4,450 | $266,070 | $43,610 | $222,460 |
| 2020 | $4,328 | $256,662 | $43,610 | $213,052 |
| 2019 | $3,916 | $240,394 | $39,298 | $201,096 |
| 2018 | $3,862 | $232,162 | $39,298 | $192,864 |
| 2017 | $3,412 | $228,438 | $36,652 | $191,786 |
| 2016 | $3,278 | $205,996 | $36,652 | $169,344 |
| 2015 | -- | $0 | $0 | $0 |
| 2014 | -- | $0 | $0 | $0 |
Source: Public Records
Map
Nearby Homes
- 1120 Esther Ln
- 1467 Nottingham Dr
- 1310 Greenleaf Rd
- 1330 Greenleaf Rd
- 1360 Greenleaf Rd
- 1425 Greenleaf Rd
- 1665 Cornerstone Ln
- 1310 Robin Hood Ln SE
- 1745 Cornerstone Ln
- 2017 Havana Rd
- 2048 Havana Rd
- 763 16th St SE
- 633 11th St SE
- 2080 La Casa Ln SE
- 609 13th St SE
- 632 17th St SE
- 2100 Richway Ln SE
- 1130 E School St
- 855 22nd St SE
- 604 Prospect St
- 1295 1295 12th-Street-se
- 1275 12th St SE
- 1305 12th St SE
- 1305 1305 12th-Street-se
- 1290 Esther Ln
- 1270 Esther Ln
- 1310 Esther Ln
- 1255 12th St SE
- 1315 12th St SE
- 1290 12th St SE
- 1250 Esther Ln
- 1270 12th St SE
- 1320 Esther Ln
- 1225 1225 12th-Street-se
- 1225 12th St SE
- 1250 12th St SE
- 1230 Esther Ln
- 1330 Esther Ln
- 1265 Sunnydale Place SE
- 1230 12th St SE