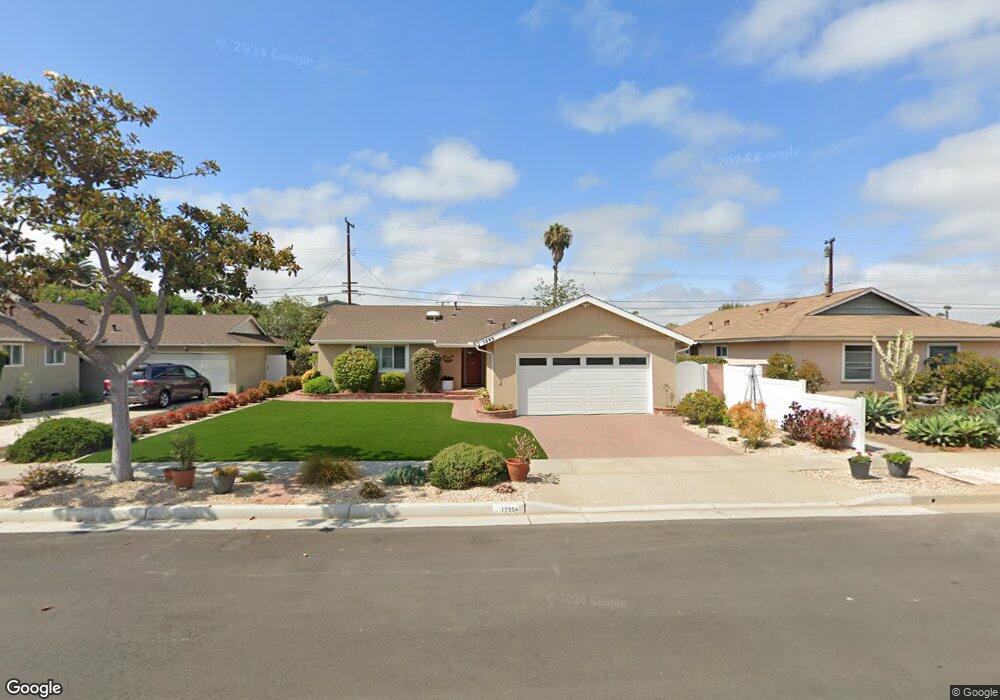
1295 Conway Ave Costa Mesa, CA 92626
Harbor Gateway NeighborhoodEstimated Value: $1,264,236 - $1,466,000
3
Beds
2
Baths
1,262
Sq Ft
$1,074/Sq Ft
Est. Value
About This Home
This home is located at 1295 Conway Ave, Costa Mesa, CA 92626 and is currently estimated at $1,355,059, approximately $1,073 per square foot. 1295 Conway Ave is a home located in Orange County with nearby schools including Killybrooke Elementary School, Costa Mesa High School, and Montessori Christian School.
Ownership History
Date
Name
Owned For
Owner Type
Purchase Details
Closed on
Dec 22, 2023
Sold by
Abbott Family Trust
Bought by
Chris & Carolyn Boyd Trust and Boyd
Current Estimated Value
Purchase Details
Closed on
Apr 5, 2023
Sold by
Abbott Heather M
Bought by
Abbott Family Trust
Purchase Details
Closed on
Mar 15, 2023
Sold by
Boyd Christopher James and Boyd Carolyn Marie
Bought by
Chris & Carolyn Boyd Trust
Purchase Details
Closed on
Oct 6, 2015
Sold by
Boyd Christopher and Boyd Carolyn
Bought by
Boyd Christopher and Boyd Carolyn
Purchase Details
Closed on
Mar 11, 1993
Sold by
Mid Exchange Ii
Bought by
Boyd Christopher and Boyd Carolyn
Home Financials for this Owner
Home Financials are based on the most recent Mortgage that was taken out on this home.
Original Mortgage
$150,000
Interest Rate
7.88%
Create a Home Valuation Report for This Property
The Home Valuation Report is an in-depth analysis detailing your home's value as well as a comparison with similar homes in the area
Home Values in the Area
Average Home Value in this Area
Purchase History
| Date | Buyer | Sale Price | Title Company |
|---|---|---|---|
| Chris & Carolyn Boyd Trust | -- | None Listed On Document | |
| Abbott Family Trust | -- | None Listed On Document | |
| Chris & Carolyn Boyd Trust | -- | -- | |
| Boyd Christopher James | -- | -- | |
| Boyd Christopher | -- | None Available | |
| Boyd Christopher | $196,000 | Fidelity National Title Ins |
Source: Public Records
Mortgage History
| Date | Status | Borrower | Loan Amount |
|---|---|---|---|
| Previous Owner | Boyd Christopher | $150,000 |
Source: Public Records
Tax History Compared to Growth
Tax History
| Year | Tax Paid | Tax Assessment Tax Assessment Total Assessment is a certain percentage of the fair market value that is determined by local assessors to be the total taxable value of land and additions on the property. | Land | Improvement |
|---|---|---|---|---|
| 2025 | $7,209 | $608,009 | $519,694 | $88,315 |
| 2024 | $7,209 | $596,088 | $509,504 | $86,584 |
| 2023 | $4,268 | $326,594 | $238,586 | $88,008 |
| 2022 | $4,085 | $320,191 | $233,908 | $86,283 |
| 2021 | $3,942 | $313,913 | $229,321 | $84,592 |
| 2020 | $3,889 | $310,695 | $226,970 | $83,725 |
| 2019 | $3,805 | $304,603 | $222,519 | $82,084 |
| 2018 | $3,727 | $298,631 | $218,156 | $80,475 |
| 2017 | $3,667 | $292,776 | $213,878 | $78,898 |
| 2016 | $3,591 | $287,036 | $209,685 | $77,351 |
| 2015 | $3,556 | $282,725 | $206,535 | $76,190 |
| 2014 | $3,477 | $277,187 | $202,489 | $74,698 |
Source: Public Records
Map
Nearby Homes
- 3149 Sharon Ln
- 1387 Garlingford St
- 1585 Baker St
- 2957 Royal Palm Dr
- 1111 S Coast Dr Unit 18
- 1081 Tulare Dr
- 3050 Madison Ave
- 2901 Royal Palm Dr
- 1110 Redding Ave
- 3131 Lincoln Way
- 3351 Via Trentino Unit 76
- 2865 Mendoza Dr
- 3119 Gibraltar Ave
- 1010 Valencia St
- 2737 Lorenzo Ave
- 3104 Samoa Place
- 994 Valencia St
- 1174 Kingston St
- 945 Brilliance Ln
- 1714 Labrador Dr
- 1291 Conway Ave
- 1299 Conway Ave
- 1306 Watson Ave
- 1302 Watson Ave
- 1310 Watson Ave
- 1287 Conway Ave
- 1298 Watson Ave
- 3074 Warren Ln
- 1294 Conway Ave
- 1290 Conway Ave
- 1283 Conway Ave
- 1311 Conway Ave
- 1294 Watson Ave
- 1318 Watson Ave
- 3080 Warren Ln
- 3056 Warren Ln
- 1279 Conway Ave
- 3077 Donnybrook Ln
- 3045 Donnybrook Ln
- 1315 Conway Ave