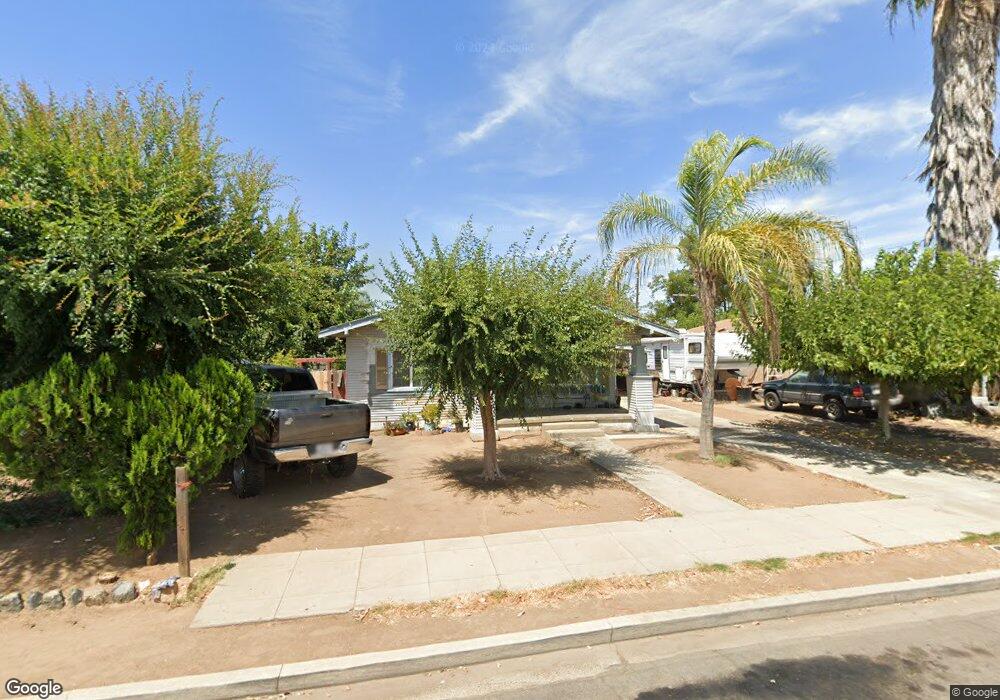
1295 E Whittaker Way Dinuba, CA 93618
Estimated Value: $209,000 - $254,000
2
Beds
1
Bath
882
Sq Ft
$265/Sq Ft
Est. Value
About This Home
This home is located at 1295 E Whittaker Way, Dinuba, CA 93618 and is currently estimated at $233,815, approximately $265 per square foot. 1295 E Whittaker Way is a home located in Tulare County with nearby schools including Jefferson Elementary School, Washington Intermediate School, and Dinuba High School.
Ownership History
Date
Name
Owned For
Owner Type
Purchase Details
Closed on
Jun 20, 2005
Sold by
Chan Ignacio Avila
Bought by
Chan Ignacio Avila
Current Estimated Value
Home Financials for this Owner
Home Financials are based on the most recent Mortgage that was taken out on this home.
Original Mortgage
$68,750
Outstanding Balance
$37,244
Interest Rate
6.35%
Mortgage Type
Purchase Money Mortgage
Estimated Equity
$196,571
Purchase Details
Closed on
May 21, 2003
Sold by
Chan Ignacio Avila
Bought by
Chan Ignacio Avila and Bautista Jose Eric
Purchase Details
Closed on
Mar 23, 1998
Sold by
Ball John Vernon
Bought by
Chan Ignacio Avila and Bautista Petra Garza
Home Financials for this Owner
Home Financials are based on the most recent Mortgage that was taken out on this home.
Original Mortgage
$47,500
Interest Rate
7%
Mortgage Type
Seller Take Back
Purchase Details
Closed on
Dec 15, 1994
Sold by
Ball John V
Bought by
Ball John Vernon and Ball Mary Ellen
Create a Home Valuation Report for This Property
The Home Valuation Report is an in-depth analysis detailing your home's value as well as a comparison with similar homes in the area
Home Values in the Area
Average Home Value in this Area
Purchase History
| Date | Buyer | Sale Price | Title Company |
|---|---|---|---|
| Chan Ignacio Avila | -- | -- | |
| Chan Ignacio Avila | -- | -- | |
| Chan Ignacio Avila | $57,500 | Chicago Title Co | |
| Ball John Vernon | -- | -- |
Source: Public Records
Mortgage History
| Date | Status | Borrower | Loan Amount |
|---|---|---|---|
| Open | Chan Ignacio Avila | $68,750 | |
| Previous Owner | Chan Ignacio Avila | $47,500 |
Source: Public Records
Tax History
| Year | Tax Paid | Tax Assessment Tax Assessment Total Assessment is a certain percentage of the fair market value that is determined by local assessors to be the total taxable value of land and additions on the property. | Land | Improvement |
|---|---|---|---|---|
| 2025 | $1,013 | $91,813 | $36,726 | $55,087 |
| 2024 | $1,013 | $90,013 | $36,006 | $54,007 |
| 2023 | $1,009 | $88,249 | $35,300 | $52,949 |
| 2022 | $955 | $86,519 | $34,608 | $51,911 |
| 2021 | $939 | $84,822 | $33,929 | $50,893 |
| 2020 | $941 | $83,952 | $33,581 | $50,371 |
| 2019 | $968 | $82,306 | $32,923 | $49,383 |
| 2018 | $922 | $80,692 | $32,277 | $48,415 |
| 2017 | $932 | $79,110 | $31,644 | $47,466 |
| 2016 | $875 | $77,559 | $31,024 | $46,535 |
| 2015 | $801 | $76,394 | $30,558 | $45,836 |
| 2014 | $801 | $72,000 | $18,000 | $54,000 |
Source: Public Records
Map
Nearby Homes
- 1166 E Park Way
- 65745 Big Meadows Rd
- 2072 E Olive Way
- 520 E Yale Ave
- 225 W Tulare St
- 277 N H St
- 1702 Bolinger Way
- 201 Bryan Ave
- 1708 Bolinger Way
- 638 W Kern St
- 340 N K St
- 200 N Uruapan Way
- 636 W Kern St
- 333 N L St
- 0 S Alta Ave
- 223 Bryan Ave
- 224 Bryan Ave
- 245 Bryan Ave
- 581 N 581 N Crawford Ave Unit 2
- 581 N Crawford Ave Unit 41
- 1329 E Whittaker Way
- 1345 E Whittaker Way
- 1275 E Whittaker Way
- 1280 E Sierra Way
- 1274 E Sierra Way
- 1298 E Sierra Way
- 1244 E Sierra Way
- 1326 E Sierra Way
- 1365 E Whittaker Way
- 1257 E Whittaker Way
- 1222 E Sierra Way
- 1298 E Whittaker Way
- 1328 E Whittaker Way
- 1286 E Whittaker Way
- 1225 E Whittaker Way
- 1336 E Whittaker Way
- 1379 E Whittaker Way
- 1268 E Whittaker Way
- 1252 E Whittaker Way
- 1350 E Sierra Way
Your Personal Tour Guide
Ask me questions while you tour the home.