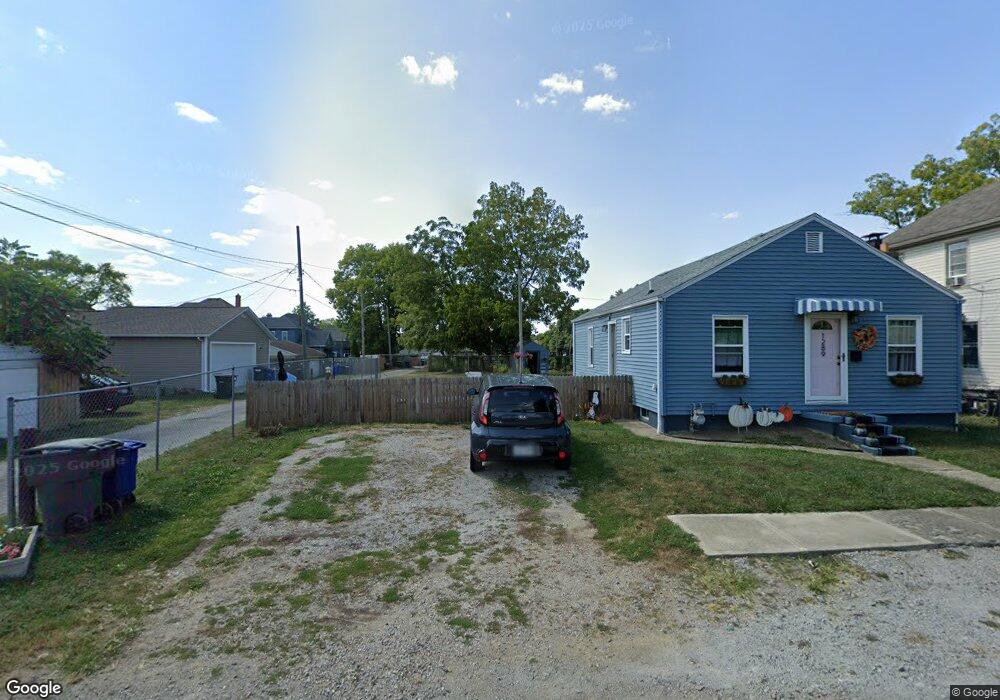
1295 S 17th St Columbus, OH 43206
Karns Park NeighborhoodEstimated Value: $47,000
5
Beds
2
Baths
2,016
Sq Ft
$23/Sq Ft
Est. Value
About This Home
This home is located at 1295 S 17th St, Columbus, OH 43206 and is currently priced at $47,000, approximately $23 per square foot. 1295 S 17th St is a home located in Franklin County with nearby schools including Lincoln Park Elementary School, South High School, and South Columbus Preparatory Academy.
Ownership History
Date
Name
Owned For
Owner Type
Purchase Details
Closed on
Jan 17, 2022
Sold by
Anderson Michelle R
Bought by
Caudill Shannon Courtney
Current Estimated Value
Home Financials for this Owner
Home Financials are based on the most recent Mortgage that was taken out on this home.
Original Mortgage
$108,007
Outstanding Balance
$99,542
Interest Rate
3.11%
Mortgage Type
FHA
Purchase Details
Closed on
Jun 3, 2004
Sold by
Columbus Housing Partnership Inc
Bought by
Anderson Michelle R
Purchase Details
Closed on
Jan 13, 2004
Sold by
Southside Homes Lp
Bought by
Columbus Housing Partnership Inc
Purchase Details
Closed on
Mar 12, 2002
Sold by
Family Mortgage Service Corporation # 13
Bought by
Southside Homes Ltd Partnership
Purchase Details
Closed on
Jul 7, 2000
Sold by
Newman Donald and New Century Mtg Corp
Bought by
Family Mtg Service Corp #13
Purchase Details
Closed on
Sep 24, 1997
Sold by
Ford Consumer Finance Company Inc
Bought by
Kahn/Vick Properties Inc
Create a Home Valuation Report for This Property
The Home Valuation Report is an in-depth analysis detailing your home's value as well as a comparison with similar homes in the area
Home Values in the Area
Average Home Value in this Area
Purchase History
| Date | Buyer | Sale Price | Title Company |
|---|---|---|---|
| Caudill Shannon Courtney | $110,000 | Allodial Title | |
| Anderson Michelle R | $1,500 | -- | |
| Columbus Housing Partnership Inc | -- | -- | |
| Southside Homes Ltd Partnership | $1,200 | -- | |
| Family Mtg Service Corp #13 | $30,000 | -- | |
| Kahn/Vick Properties Inc | $19,800 | Ohio Title |
Source: Public Records
Mortgage History
| Date | Status | Borrower | Loan Amount |
|---|---|---|---|
| Open | Caudill Shannon Courtney | $108,007 |
Source: Public Records
Tax History Compared to Growth
Tax History
| Year | Tax Paid | Tax Assessment Tax Assessment Total Assessment is a certain percentage of the fair market value that is determined by local assessors to be the total taxable value of land and additions on the property. | Land | Improvement |
|---|---|---|---|---|
| 2022 | $199 | $3,750 | $3,750 | $0 |
| 2021 | $200 | $3,750 | $3,750 | $0 |
| 2020 | $200 | $3,750 | $3,750 | $0 |
| 2019 | $194 | $3,120 | $3,120 | $0 |
| 2018 | $165 | $3,120 | $3,120 | $0 |
| 2017 | $172 | $3,120 | $3,120 | $0 |
| 2016 | $150 | $2,210 | $2,210 | $0 |
| 2015 | $137 | $2,210 | $2,210 | $0 |
| 2014 | $137 | $2,210 | $2,210 | $0 |
| 2013 | $71 | $2,310 | $2,310 | $0 |
Source: Public Records
Map
Nearby Homes
- 554 Hanford St
- 621-627 E Gates St
- 523 Hanford St
- 565 E Mithoff St
- 546 Frebis Ave
- 1274 Wager St
- 601 Frebis Ave
- 563 Frebis Ave
- 515 E Mithoff St
- 605 Frebis Ave
- 609 Frebis Ave
- 1240 S 17th St
- 650 E Mithoff St
- 530 E Moler St
- 524 Thurman Ave
- 1252 Parsons Ave
- 676 E Moler St
- 693 Thurman Ave
- 1178 Wager St
- 706 Frebis Ave
- 1289 S 17th St
- 1285 S 17th St
- 582 E Gates St
- 578 E Gates St
- 574 E Gates St
- 596 E Gates St
- 595 E Mithoff St
- 570 E Gates St
- 570 E Gates St
- 1296 S 17th St
- 592-598 E Gates St
- 1288 S 17th St
- 592 E Gates St Unit 4
- 592 E Gates St
- 600 E Gates St Unit 602
- 600-602 E Gates St
- 591 E Mithoff St Unit 595
- 587 E Mithoff St
- 558 E Gates St
- 603 E Mithoff St