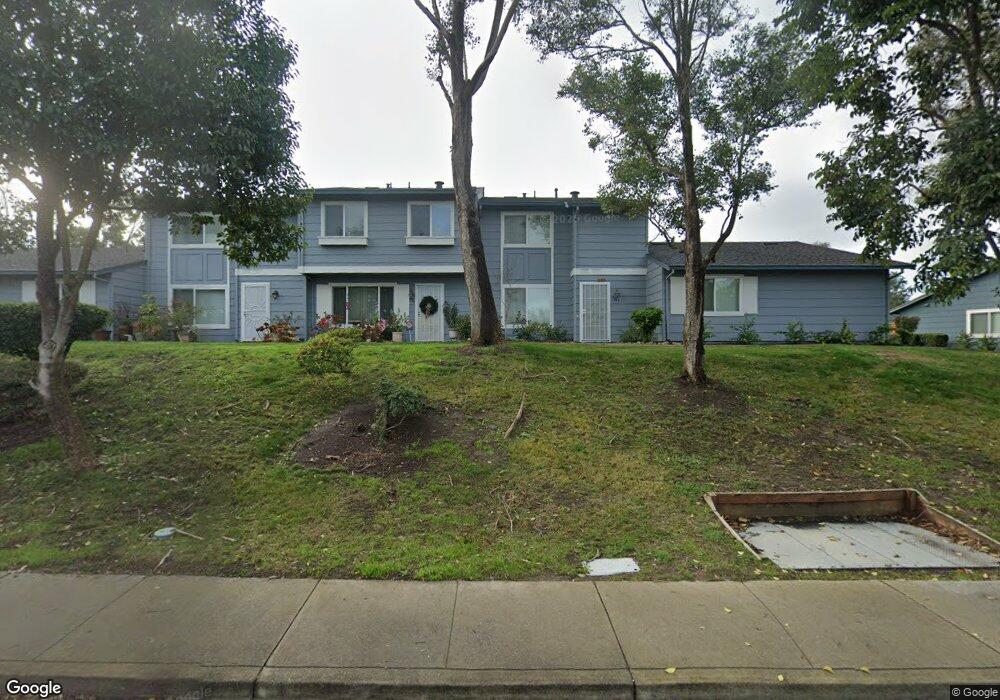
1295 Spring Valley Common Livermore, CA 94551
Springtown NeighborhoodEstimated Value: $632,000 - $675,000
3
Beds
2
Baths
1,274
Sq Ft
$507/Sq Ft
Est. Value
About This Home
This home is located at 1295 Spring Valley Common, Livermore, CA 94551 and is currently estimated at $646,423, approximately $507 per square foot. 1295 Spring Valley Common is a home located in Alameda County with nearby schools including Altamont Creek Elementary School, Andrew N. Christensen Middle School, and Livermore High School.
Ownership History
Date
Name
Owned For
Owner Type
Purchase Details
Closed on
Oct 21, 2019
Sold by
Soma Anil Kumar
Bought by
Soma Anil Kumar and Vangala Sumani
Current Estimated Value
Home Financials for this Owner
Home Financials are based on the most recent Mortgage that was taken out on this home.
Original Mortgage
$475,000
Outstanding Balance
$417,811
Interest Rate
3.7%
Mortgage Type
New Conventional
Estimated Equity
$228,612
Purchase Details
Closed on
Sep 11, 2018
Sold by
Raina Shivani
Bought by
Soma Anil Kumar
Home Financials for this Owner
Home Financials are based on the most recent Mortgage that was taken out on this home.
Original Mortgage
$490,500
Interest Rate
4.5%
Mortgage Type
New Conventional
Purchase Details
Closed on
Sep 12, 2016
Sold by
Gasper Kevin
Bought by
Raina Shivani
Home Financials for this Owner
Home Financials are based on the most recent Mortgage that was taken out on this home.
Original Mortgage
$434,201
Interest Rate
4.4%
Mortgage Type
FHA
Purchase Details
Closed on
Feb 4, 2011
Sold by
Lowder Susan
Bought by
Gasper Kevin
Home Financials for this Owner
Home Financials are based on the most recent Mortgage that was taken out on this home.
Original Mortgage
$217,076
Interest Rate
4.37%
Mortgage Type
FHA
Purchase Details
Closed on
Mar 1, 2004
Sold by
Johnson Kurt and Johnson Marie
Bought by
Lowder Susan
Home Financials for this Owner
Home Financials are based on the most recent Mortgage that was taken out on this home.
Original Mortgage
$253,520
Interest Rate
5.62%
Mortgage Type
Purchase Money Mortgage
Purchase Details
Closed on
Aug 29, 2000
Sold by
Beeman Linda and Beeman Linda
Bought by
Johnson Kurt and Johnson Marie
Home Financials for this Owner
Home Financials are based on the most recent Mortgage that was taken out on this home.
Original Mortgage
$223,696
Interest Rate
8.2%
Mortgage Type
FHA
Purchase Details
Closed on
Dec 18, 1995
Sold by
Hill Coletta M
Bought by
Beeman Linda
Purchase Details
Closed on
Sep 19, 1995
Sold by
Hill Coletta M
Bought by
Beeman Linda
Create a Home Valuation Report for This Property
The Home Valuation Report is an in-depth analysis detailing your home's value as well as a comparison with similar homes in the area
Home Values in the Area
Average Home Value in this Area
Purchase History
| Date | Buyer | Sale Price | Title Company |
|---|---|---|---|
| Soma Anil Kumar | -- | Chicago Title Company | |
| Soma Anil Kumar | $545,000 | North American Title Company | |
| Soma Anil Kumar | -- | North American Title Company | |
| Raina Shivani | $450,000 | Lawyers Title Company | |
| Gasper Kevin | -- | Lawyers Title Company | |
| Gasper Kevin | $220,000 | Old Republic Title Company | |
| Lowder Susan | $317,000 | Old Republic Title Company | |
| Johnson Kurt | $229,500 | Chicago Title Co | |
| Beeman Linda | -- | Commonwealth Land Title Co | |
| Beeman Linda | $132,500 | Commonwealth Land Title Co |
Source: Public Records
Mortgage History
| Date | Status | Borrower | Loan Amount |
|---|---|---|---|
| Open | Soma Anil Kumar | $475,000 | |
| Closed | Soma Anil Kumar | $490,500 | |
| Previous Owner | Raina Shivani | $434,201 | |
| Previous Owner | Gasper Kevin | $217,076 | |
| Previous Owner | Lowder Susan | $253,520 | |
| Previous Owner | Johnson Kurt | $223,696 |
Source: Public Records
Tax History
| Year | Tax Paid | Tax Assessment Tax Assessment Total Assessment is a certain percentage of the fair market value that is determined by local assessors to be the total taxable value of land and additions on the property. | Land | Improvement |
|---|---|---|---|---|
| 2025 | $7,676 | $600,947 | $182,384 | $425,563 |
| 2024 | $7,676 | $589,027 | $178,808 | $417,219 |
| 2023 | $7,563 | $584,343 | $175,303 | $409,040 |
| 2022 | $7,455 | $565,887 | $171,866 | $401,021 |
| 2021 | $7,305 | $554,654 | $168,496 | $393,158 |
| 2020 | $7,073 | $555,900 | $166,770 | $389,130 |
| 2019 | $7,082 | $545,000 | $163,500 | $381,500 |
| 2018 | $6,134 | $459,000 | $137,700 | $321,300 |
| 2017 | $5,979 | $450,000 | $135,000 | $315,000 |
| 2016 | $3,259 | $238,094 | $71,428 | $166,666 |
| 2015 | $3,086 | $234,520 | $70,356 | $164,164 |
| 2014 | $3,043 | $229,925 | $68,977 | $160,948 |
Source: Public Records
Map
Nearby Homes
- 1128 Larkspur Dr
- 1031 Spring Valley Common
- 1264 Tulip Way
- 1905 Monterey Dr
- 4363 Golf Dr
- 5251 Peony Dr
- 884 Sungold Cir Unit 123
- 1817 Bluebell Dr
- 5365 Windflower Dr
- 5457 Treeflower Dr
- 5473 Rainflower Dr
- 4723 Marengo Common
- 4707 Marengo Common
- 4711 Marengo Common
- 4715 Marengo Common
- 4128 Camrose Ave
- 4003 Loch Lomand Way
- 883 Barney Com
- 2060 Broadmoor St
- 3873 Inverness Common
- 1289 Spring Valley Cm
- 1289 Spring Valley Common
- 1297 Spring Valley Common
- 1283 Spring Valley Common
- 1271 Spring Valley Common
- 1301 Spring Valley Common
- 1317 Spring Valley Common
- 1267 Spring Valley Common
- 1337 Spring Valley Common
- 1255 Spring Valley Common Unit 34
- 1255 Spring Valley Common
- 1304 Spring Valley Common
- 1312 Spring Valley Common
- 1341 Spring Valley Common
- 1251 Spring Valley Common
- 1320 Spring Valley Common
- 1249 Spring Valley Common
- 1334 Spring Valley Common
- 1345 Spring Valley Common
- 1346 Spring Valley Common
Your Personal Tour Guide
Ask me questions while you tour the home.