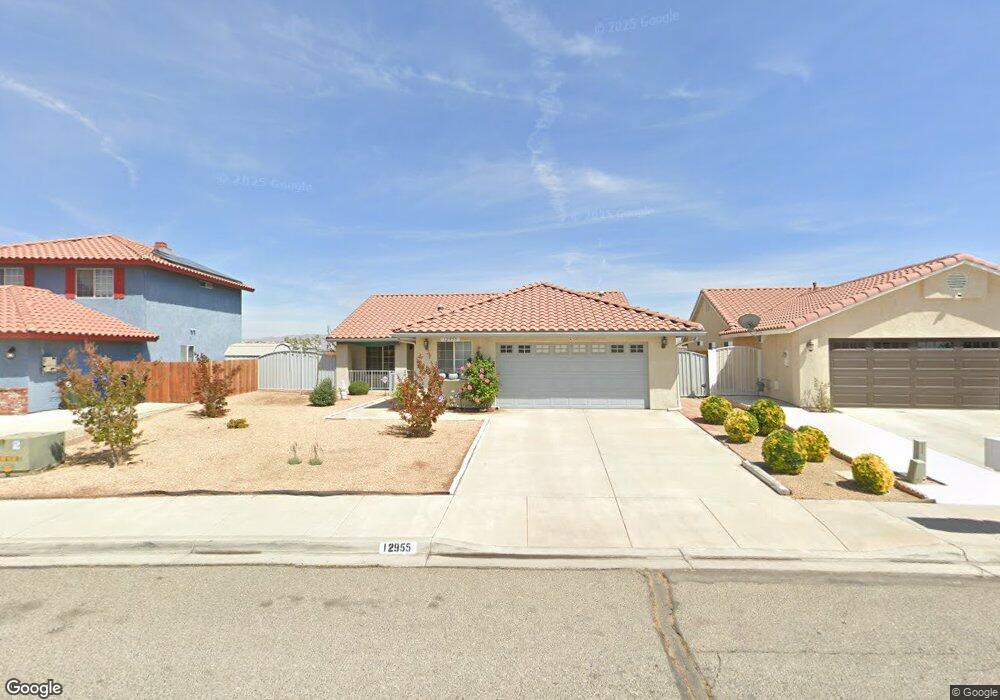
12955 High Vista St Victorville, CA 92395
Estimated Value: $428,835 - $463,000
3
Beds
2
Baths
1,560
Sq Ft
$284/Sq Ft
Est. Value
About This Home
This home is located at 12955 High Vista St, Victorville, CA 92395 and is currently estimated at $443,209, approximately $284 per square foot. 12955 High Vista St is a home located in San Bernardino County with nearby schools including Lomitas Elementary School, Mojave Vista Elementary School, and Lakeview Leadership Academy.
Ownership History
Date
Name
Owned For
Owner Type
Purchase Details
Closed on
Mar 27, 2023
Sold by
Maugenest Margaret
Bought by
M Maugenest Revocable Living Trust
Current Estimated Value
Purchase Details
Closed on
Feb 21, 2023
Sold by
Olly Y Maugenest Revocable Living Trust
Bought by
Maugenest Margaret
Purchase Details
Closed on
Oct 10, 2014
Sold by
Maugenest Olly Y
Bought by
Revocable Living Trust Olly Y Maugenest
Purchase Details
Closed on
Jun 6, 2014
Sold by
Estate Of Willem Maugenest Revliv Tr
Bought by
Maugenest Olly Y
Purchase Details
Closed on
May 20, 2004
Sold by
Rentfro Isabella Rue
Bought by
Maugenest Olly Y and The Olly Y Maugenest Revocable
Purchase Details
Closed on
Feb 9, 2000
Sold by
Rentfro Arnold F
Bought by
Rentfro Arnold F and Rentfro Isabelle Rue
Purchase Details
Closed on
Jun 11, 1999
Sold by
Spring Valley Ridge Llc
Bought by
Rentfro Arnold F and Rentgro Isabelle R
Create a Home Valuation Report for This Property
The Home Valuation Report is an in-depth analysis detailing your home's value as well as a comparison with similar homes in the area
Home Values in the Area
Average Home Value in this Area
Purchase History
| Date | Buyer | Sale Price | Title Company |
|---|---|---|---|
| M Maugenest Revocable Living Trust | -- | -- | |
| Maugenest Margaret | -- | -- | |
| Revocable Living Trust Olly Y Maugenest | -- | None Available | |
| Maugenest Olly Y | -- | None Available | |
| Maugenest Olly Y | $255,000 | Stewart Title Company | |
| Rentfro Arnold F | -- | -- | |
| Rentfro Arnold F | $138,500 | First American Title Ins Co |
Source: Public Records
Tax History Compared to Growth
Tax History
| Year | Tax Paid | Tax Assessment Tax Assessment Total Assessment is a certain percentage of the fair market value that is determined by local assessors to be the total taxable value of land and additions on the property. | Land | Improvement |
|---|---|---|---|---|
| 2025 | $3,364 | $279,575 | $63,910 | $215,665 |
| 2024 | $3,364 | $274,093 | $62,657 | $211,436 |
| 2023 | $3,332 | $268,718 | $61,428 | $207,290 |
| 2022 | $3,276 | $263,449 | $60,224 | $203,225 |
| 2021 | $3,219 | $258,283 | $59,043 | $199,240 |
| 2020 | $3,201 | $255,635 | $58,438 | $197,197 |
| 2019 | $3,150 | $250,622 | $57,292 | $193,330 |
| 2018 | $2,916 | $225,600 | $45,400 | $180,200 |
| 2017 | $2,706 | $209,800 | $42,200 | $167,600 |
| 2016 | $2,501 | $194,300 | $39,100 | $155,200 |
| 2015 | $2,254 | $179,000 | $36,000 | $143,000 |
| 2014 | $1,818 | $145,000 | $28,800 | $116,200 |
Source: Public Records
Map
Nearby Homes
- 12848 Autumn Leaves Ave
- 12896 Rain Shadow Rd
- 12802 Rain Shadow Rd
- 729 Park Glen St
- 17849 Pebble Beach Dr
- 12775 Rain Shadow Rd
- 13090 Yellowstone Ave
- 17895 Cumberland Way
- 13135 Yellowstone Ave
- 17668 Park Terrace Ct
- 12840 Santa Anita Trail
- 13250 Yellowstone Ave
- 13090 Candleberry Ln
- 13145 Palos Grande Dr
- 18065 Pebble Beach Dr
- 13220 Tamarisk Rd
- 13190 Palos Grande Dr
- 17705 Vista Point Dr
- 17725 Vista Point Dr
- 13064 Sage Hen Rd
- 12963 High Vista St
- 12947 High Vista St
- 12971 High Vista St
- 12939 High Vista St
- 12981 High Vista St
- 12960 High Vista St
- 12933 High Vista St
- 12946 High Vista St
- 12972 High Vista St
- 12930 Autumn Leaves Ave
- 12940 Autumn Leaves Ave
- 12982 High Vista St
- 12959 High Crest St
- 12950 Autumn Leaves Ave
- 12999 High Vista St
- 12920 Autumn Leaves Ave
- 12971 High Crest St
- 12911 High Vista St
- 12981 High Crest St
- 12922 High Vista St