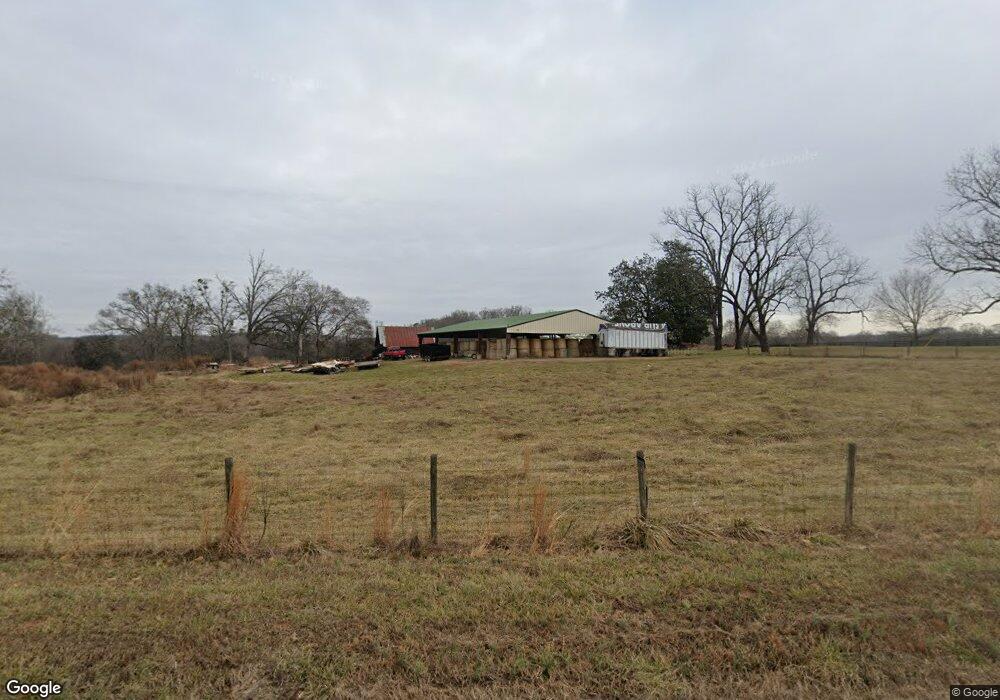
1296 Finch Rd Winder, GA 30680
Estimated Value: $779,000
--
Bed
2
Baths
--
Sq Ft
130.9
Acres
About This Home
This home is located at 1296 Finch Rd, Winder, GA 30680 and is currently estimated at $779,000. 1296 Finch Rd is a home located in Barrow County with nearby schools including Holsenbeck Elementary School, Bear Creek Middle School, and Winder-Barrow High School.
Ownership History
Date
Name
Owned For
Owner Type
Purchase Details
Closed on
Mar 3, 2022
Sold by
Jacobs Angela
Bought by
Finch Road Developers Llc
Current Estimated Value
Purchase Details
Closed on
Feb 16, 2021
Sold by
Brewer Billie Jean
Bought by
Jacobs Angela and Brewer Craig
Purchase Details
Closed on
Sep 18, 2013
Sold by
Maridian Ansley Llc
Bought by
Peachtree Securities Co
Purchase Details
Closed on
Jul 15, 2013
Sold by
Meridian Ansley Llc
Bought by
Brewer Jim L And
Purchase Details
Closed on
Jul 11, 2013
Sold by
Psb Credit Services Inc
Bought by
Meridian Ansley Llc
Purchase Details
Closed on
Feb 5, 2013
Sold by
Hudgins Holdings Llc
Bought by
Psb Cr Svcs Inc
Purchase Details
Closed on
Jul 11, 2008
Sold by
Hudgins Gerald W
Bought by
Hudgins Holdings Llc
Purchase Details
Closed on
Apr 21, 1999
Sold by
Segars William R
Bought by
Hudgins Gerald W
Create a Home Valuation Report for This Property
The Home Valuation Report is an in-depth analysis detailing your home's value as well as a comparison with similar homes in the area
Home Values in the Area
Average Home Value in this Area
Purchase History
| Date | Buyer | Sale Price | Title Company |
|---|---|---|---|
| Finch Road Developers Llc | $1,708,472 | -- | |
| Jacobs Angela | -- | -- | |
| Peachtree Securities Co | -- | -- | |
| Brewer Jim L And | $1,149,100 | -- | |
| Meridian Ansley Llc | -- | -- | |
| Psb Cr Svcs Inc | $2,313,793 | -- | |
| Hudgins Holdings Llc | -- | -- | |
| Hudgins Gerald W | -- | -- |
Source: Public Records
Tax History Compared to Growth
Tax History
| Year | Tax Paid | Tax Assessment Tax Assessment Total Assessment is a certain percentage of the fair market value that is determined by local assessors to be the total taxable value of land and additions on the property. | Land | Improvement |
|---|---|---|---|---|
| 2024 | $10,069 | $414,105 | $406,185 | $7,920 |
| 2023 | $11,623 | $414,105 | $406,185 | $7,920 |
| 2022 | $9,506 | $338,018 | $330,098 | $7,920 |
| 2021 | $8,920 | $298,365 | $290,445 | $7,920 |
| 2020 | $1,959 | $298,365 | $290,445 | $7,920 |
| 2019 | $1,945 | $298,365 | $290,445 | $7,920 |
| 2018 | $1,875 | $298,365 | $290,445 | $7,920 |
| 2017 | $8,687 | $298,365 | $290,445 | $7,920 |
| 2016 | $2,399 | $323,991 | $296,094 | $27,898 |
| 2015 | $2,387 | $324,680 | $296,094 | $28,586 |
| 2014 | $2,501 | $216,158 | $186,539 | $29,620 |
| 2013 | -- | $337,820 | $244,629 | $93,190 |
Source: Public Records
Map
Nearby Homes
- 212 Rainbow Ln
- 1724 Cedar Grove Church Rd
- 51 Brockton Way Unit 2
- 385 Finch Landing Rd
- 670 Cedar Grove Church Rd
- 670 Cedar Grove Church Rd
- 1431 Solomon Dr
- 0 W H Hayes Rd
- 1212 Highway 211 NE
- 1226 Highway 211 NE
- 1023 Solomon Ct
- 1553 Shoal Creek Dr
- 1453 Solomon Dr
- 1556 Shoal Creek Dr
- 0 Hancock Bridge Rd Unit 10535063
- 281 Delightful Way Unit 7
- 253 Delightful Way Unit 6
- 63 Delightful Way Unit 1
- 203 Delightful Way Unit 5
- 296 Delightful Way Unit 22
- 1288 Finch Rd
- 2018 Finch Dr
- 1292 Finch Rd
- 1261 Finch Rd
- 1325 Finch Rd
- 1231 Finch Rd
- 1223 Finch Rd
- 508 Mulberry River Rd
- 1330 Finch Rd
- 1 Finch Dr
- 0 Finch Dr Unit 7480200
- 0 Finch Dr Unit 8384100
- 175 Finch Ct Unit LOT 40
- 185 Finch Ct Unit LOT 39
- 227 Finch Ct Unit LOT 37
- 515 Mulberry River Rd
- 205 Finch Ct Unit LOT 38
- 295 Finch Ct Unit LOT 35
- 01 Finch Dr
- 426 Mulberry River Rd