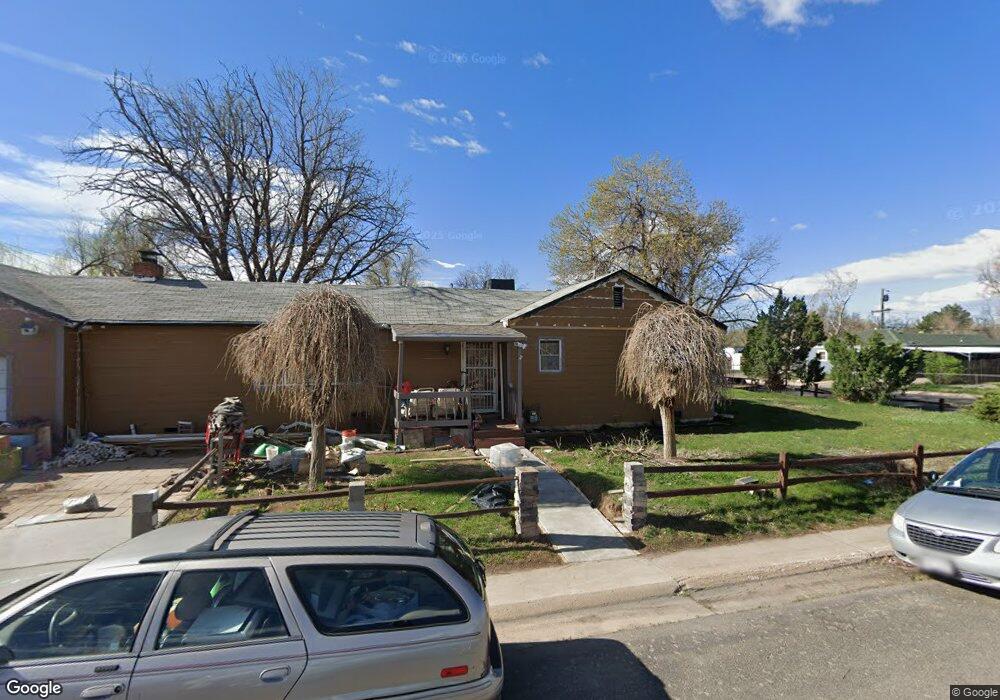
1296 Hanover St Aurora, CO 80010
Del Mar Parkway NeighborhoodEstimated Value: $360,000 - $387,000
Studio
1
Bath
1,360
Sq Ft
$276/Sq Ft
Est. Value
About This Home
This home is located at 1296 Hanover St, Aurora, CO 80010 and is currently estimated at $375,765, approximately $276 per square foot. 1296 Hanover St is a home located in Arapahoe County with nearby schools including Kenton Elementary School, Aurora West College Preparatory Academy, and Aurora Central High School.
Ownership History
Date
Name
Owned For
Owner Type
Purchase Details
Closed on
Jan 25, 2024
Sold by
Breaze James Albert
Bought by
Mountain View Investment Corp
Current Estimated Value
Purchase Details
Closed on
Jan 12, 2023
Sold by
Breaze Ida Lolene
Bought by
Gerkin Phillip R and Breaze James Albert
Purchase Details
Closed on
May 26, 2022
Sold by
Vernon Collins
Bought by
Collins Vernon O
Purchase Details
Closed on
Feb 4, 2022
Sold by
Breaze James A
Bought by
Collins Vernon and Breaze Shari D
Purchase Details
Closed on
Oct 29, 1993
Sold by
Gonzalez Ernesto and Gonzalez Mina L
Bought by
Jessop Gordon L
Purchase Details
Closed on
Mar 21, 1988
Sold by
Conversion Arapco
Bought by
Breaze James A Personal Representative
Purchase Details
Closed on
Jul 4, 1776
Bought by
Conversion Arapco
Create a Home Valuation Report for This Property
The Home Valuation Report is an in-depth analysis detailing your home's value as well as a comparison with similar homes in the area
Home Values in the Area
Average Home Value in this Area
Purchase History
| Date | Buyer | Sale Price | Title Company |
|---|---|---|---|
| Mountain View Investment Corp | $155,000 | None Listed On Document | |
| Mountain View Investment Corp | -- | None Listed On Document | |
| Gerkin Phillip R | $155,000 | -- | |
| Collins Vernon O | $276,612 | None Listed On Document | |
| Collins Vernon | -- | None Listed On Document | |
| Collins Vernon | -- | None Listed On Document | |
| Jessop Gordon L | $49,500 | Security Title Guaranty Co | |
| Breaze James A Personal Representative | -- | -- | |
| Conversion Arapco | -- | -- |
Source: Public Records
Tax History
| Year | Tax Paid | Tax Assessment Tax Assessment Total Assessment is a certain percentage of the fair market value that is determined by local assessors to be the total taxable value of land and additions on the property. | Land | Improvement |
|---|---|---|---|---|
| 2025 | $2,540 | $24,888 | -- | -- |
| 2024 | $2,534 | $26,505 | -- | -- |
| 2023 | $2,534 | $26,505 | $0 | $0 |
| 2022 | $2,211 | $22,018 | $0 | $0 |
| 2021 | $2,282 | $22,018 | $0 | $0 |
| 2020 | $2,122 | $20,378 | $0 | $0 |
| 2019 | $2,110 | $20,378 | $0 | $0 |
| 2018 | $1,797 | $16,992 | $0 | $0 |
| 2017 | $1,563 | $16,992 | $0 | $0 |
| 2016 | $603 | $12,839 | $0 | $0 |
| 2015 | $582 | $12,839 | $0 | $0 |
| 2014 | -- | $7,650 | $0 | $0 |
| 2013 | -- | $8,640 | $0 | $0 |
Source: Public Records
Map
Nearby Homes
- 1286 Hanover St
- 1266 Hanover St
- 1295 Havana St
- 1300 Hanover St
- 1283 Havana St
- 1254 Hanover St
- 1271 Havana St
- 10360 E 13th Ave
- 1275 Hanover St
- 1320 Hanover St
- 1315 Havana St
- 1259 Havana St
- 1240 Hanover St
- 1201 Hanover St
- 1303 Hanover St
- 1321 Havana St
- 1247 Havana St
- 1242 Del Mar Pkwy
- 10350 E 13th Ave
- 1336 Hanover St
Your Personal Tour Guide
Ask me questions while you tour the home.