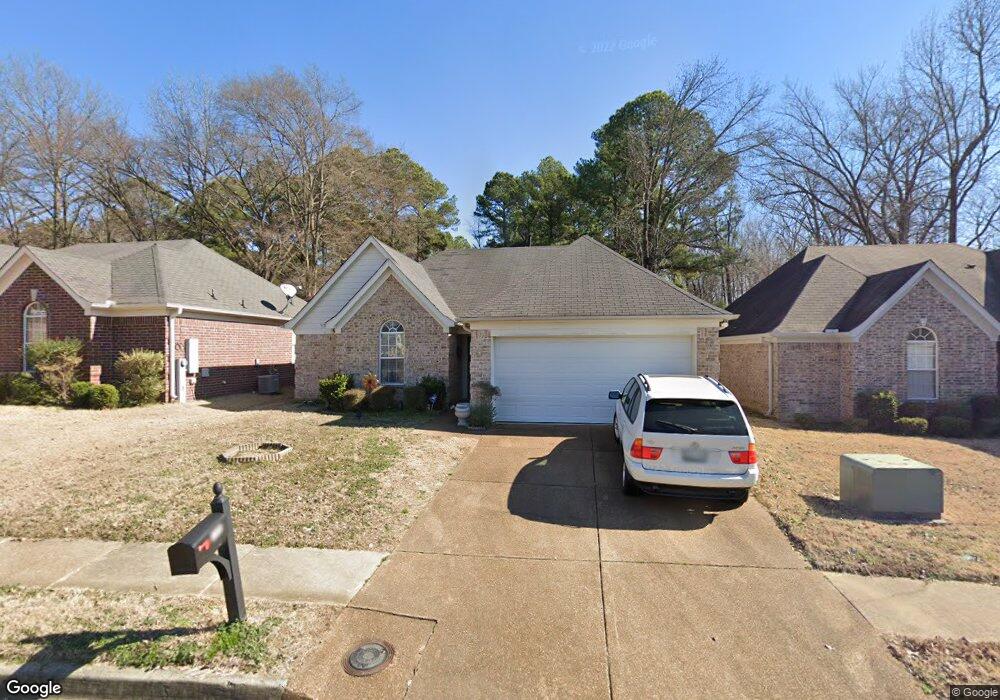
1296 Lagrange Downs Rd Cordova, TN 38018
Cordova NeighborhoodEstimated Value: $213,430 - $235,000
3
Beds
2
Baths
1,425
Sq Ft
$159/Sq Ft
Est. Value
About This Home
This home is located at 1296 Lagrange Downs Rd, Cordova, TN 38018 and is currently estimated at $227,108, approximately $159 per square foot. 1296 Lagrange Downs Rd is a home located in Shelby County with nearby schools including Dexter Elementary School, Dexter Middle School, and Cordova High School.
Ownership History
Date
Name
Owned For
Owner Type
Purchase Details
Closed on
Jan 3, 2024
Sold by
Essential Properties Llc
Bought by
Yamasa Co Ltd
Current Estimated Value
Purchase Details
Closed on
Nov 1, 2023
Sold by
Mcfarland Jo Ann
Bought by
Essential Properties Llc
Purchase Details
Closed on
May 31, 2007
Sold by
Mcfarland Brenda
Bought by
Mcfarland Jo Ann
Home Financials for this Owner
Home Financials are based on the most recent Mortgage that was taken out on this home.
Original Mortgage
$133,400
Interest Rate
6.16%
Mortgage Type
Purchase Money Mortgage
Purchase Details
Closed on
Apr 30, 2004
Sold by
Compass Pointe Homes Llc
Bought by
Mcfarland Brenda
Home Financials for this Owner
Home Financials are based on the most recent Mortgage that was taken out on this home.
Original Mortgage
$101,360
Interest Rate
4.95%
Mortgage Type
Purchase Money Mortgage
Create a Home Valuation Report for This Property
The Home Valuation Report is an in-depth analysis detailing your home's value as well as a comparison with similar homes in the area
Home Values in the Area
Average Home Value in this Area
Purchase History
| Date | Buyer | Sale Price | Title Company |
|---|---|---|---|
| Yamasa Co Ltd | $225,000 | Titan Title Company | |
| Essential Properties Llc | $190,000 | Titan Title Company | |
| Mcfarland Jo Ann | $133,400 | None Available | |
| Mcfarland Brenda | $126,700 | -- |
Source: Public Records
Mortgage History
| Date | Status | Borrower | Loan Amount |
|---|---|---|---|
| Previous Owner | Mcfarland Jo Ann | $133,400 | |
| Previous Owner | Mcfarland Brenda | $101,360 | |
| Closed | Mcfarland Brenda | $25,340 |
Source: Public Records
Tax History
| Year | Tax Paid | Tax Assessment Tax Assessment Total Assessment is a certain percentage of the fair market value that is determined by local assessors to be the total taxable value of land and additions on the property. | Land | Improvement |
|---|---|---|---|---|
| 2025 | $1,222 | $54,750 | $8,750 | $46,000 |
| 2024 | -- | $36,050 | $6,875 | $29,175 |
| 2023 | $1,222 | $36,050 | $6,875 | $29,175 |
| 2022 | $1,222 | $36,050 | $6,875 | $29,175 |
| 2021 | $1,244 | $36,050 | $6,875 | $29,175 |
| 2020 | $1,188 | $29,325 | $6,875 | $22,450 |
| 2019 | $1,188 | $29,325 | $6,875 | $22,450 |
| 2018 | $1,188 | $29,325 | $6,875 | $22,450 |
| 2017 | $1,205 | $29,325 | $6,875 | $22,450 |
| 2016 | $1,155 | $26,425 | $0 | $0 |
Source: Public Records
Map
Nearby Homes
- 6864 Lagrange Hill Rd
- 6900 Lagrange Hill Rd
- 6989 Amberly Way Dr
- 1259 Breezy Gate Dr
- 1239 Whitten Rd
- 6916 Lagrange Pines Rd
- 6907 Manslick Rd
- 6880 Wrigley Dr
- 6884 Wrigley Dr
- 0 Harpeth Dr
- 7106 Anise Tree Dr
- 1066 Whitten Rd
- 1077 Jessica Lauren Dr
- 1475 S Goodlett Grove Cove
- 1264 Charles Bryan Rd
- 1564 Wynne Rd
- 990 Jessica Lauren Dr
- 6972 Parkbrook Ln
- 6452 Macon Rd
- 1432 Bridgewater Rd
- 1290 Lagrange Downs Rd
- 1300 Lagrange Downs Rd
- 1286 Lagrange Downs Rd
- 1306 Lagrange Downs Rd
- 6861 Kamali Ave
- 6860 Kerry Valley Ln
- 1282 Lagrange Downs Rd
- 1312 Lagrange Downs Rd
- 6857 Kamali Ave
- 6854 Kerry Valley Ln
- 1276 Lagrange Downs Rd
- 1332 Lagrange Downs Rd
- 6858 Kamali Ave
- 6853 Kamali Ave
- 6850 Kerry Valley Ln
- 6868 Gallop Dr
- 6849 Kamali Ave
- 6852 Kamali Ave
- 1272 Lagrange Downs Rd
- 6861 Kerry Valley Ln
Your Personal Tour Guide
Ask me questions while you tour the home.