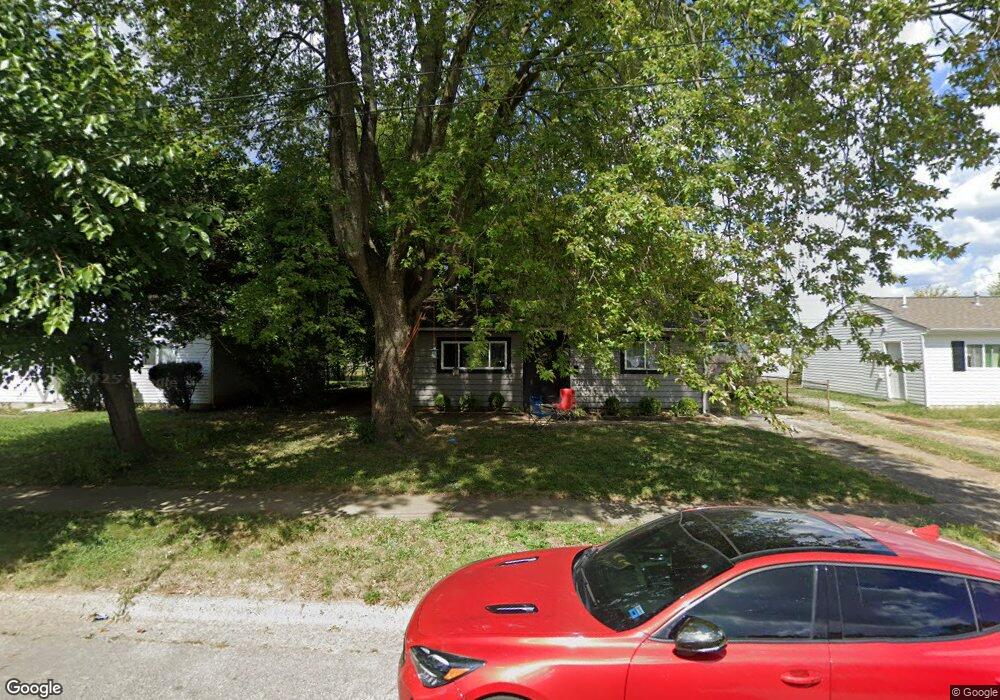
1296 Midway Ave Columbus, OH 43207
Marion Franklin NeighborhoodEstimated Value: $106,000 - $177,000
3
Beds
1
Bath
--
Sq Ft
5,968
Sq Ft Lot
About This Home
This home is located at 1296 Midway Ave, Columbus, OH 43207 and is currently estimated at $150,441. 1296 Midway Ave is a home located in Franklin County with nearby schools including Watkins Elementary School, Buckeye Middle School, and Marion-Franklin High School.
Ownership History
Date
Name
Owned For
Owner Type
Purchase Details
Closed on
Sep 5, 2025
Sold by
Key Palm 3 Llc
Bought by
Wbr Equity Llc
Current Estimated Value
Purchase Details
Closed on
Jun 16, 2022
Sold by
Acq Equity Llc
Bought by
Key Palm 3 Llc
Purchase Details
Closed on
Jan 10, 2022
Sold by
Bak Investments Llc
Bought by
Acq Equity Llc
Home Financials for this Owner
Home Financials are based on the most recent Mortgage that was taken out on this home.
Original Mortgage
$594,000
Interest Rate
3.12%
Mortgage Type
Credit Line Revolving
Purchase Details
Closed on
Dec 27, 2021
Sold by
Bak Investments Llc
Bought by
Acq Equity Llc
Home Financials for this Owner
Home Financials are based on the most recent Mortgage that was taken out on this home.
Original Mortgage
$594,000
Interest Rate
3.12%
Mortgage Type
Credit Line Revolving
Purchase Details
Closed on
Jun 19, 2013
Sold by
Poling Don D and Poling Kelly A
Bought by
Bak Investments Llc
Home Financials for this Owner
Home Financials are based on the most recent Mortgage that was taken out on this home.
Original Mortgage
$60,000
Interest Rate
4.49%
Mortgage Type
New Conventional
Purchase Details
Closed on
Mar 1, 2007
Sold by
Poling Don D and Poling Kelly A
Bought by
Bak Investments Llc
Purchase Details
Closed on
Feb 1, 2007
Sold by
Poling Don D and Poling Kelly A
Bought by
Bak Investments Llc
Purchase Details
Closed on
Nov 15, 2005
Sold by
Green Hill Investments Llc
Bought by
Poling Don D and Poling Kelly A
Home Financials for this Owner
Home Financials are based on the most recent Mortgage that was taken out on this home.
Original Mortgage
$56,800
Interest Rate
7%
Mortgage Type
Purchase Money Mortgage
Purchase Details
Closed on
Sep 1, 2005
Sold by
Green Hill Investments Llc
Bought by
Poling Land Investments Llc
Home Financials for this Owner
Home Financials are based on the most recent Mortgage that was taken out on this home.
Original Mortgage
$430,000
Interest Rate
5.82%
Mortgage Type
Seller Take Back
Purchase Details
Closed on
Jul 21, 2004
Sold by
Decker Todd and Decker Betsy S
Bought by
Green Hill Investments Llc
Purchase Details
Closed on
Dec 11, 2002
Sold by
Decker Todd K and Decker Todd
Bought by
Decker Todd K and Decker Betsy S
Home Financials for this Owner
Home Financials are based on the most recent Mortgage that was taken out on this home.
Original Mortgage
$43,000
Interest Rate
6.13%
Purchase Details
Closed on
Apr 22, 2002
Sold by
Kelley Jack E
Bought by
Decker Todd
Create a Home Valuation Report for This Property
The Home Valuation Report is an in-depth analysis detailing your home's value as well as a comparison with similar homes in the area
Home Values in the Area
Average Home Value in this Area
Purchase History
| Date | Buyer | Sale Price | Title Company |
|---|---|---|---|
| Wbr Equity Llc | -- | Win Title | |
| Key Palm 3 Llc | -- | Bricker & Eckler Llp | |
| Acq Equity Llc | $540,000 | Pm Title | |
| Acq Equity Llc | $540,000 | Pm Title | |
| Bak Investments Llc | -- | None Available | |
| Poling Don D | -- | None Available | |
| Bak Investments Llc | -- | Golden Titl | |
| Bak Investments Llc | -- | Golden Titl | |
| Poling Don D | $47,500 | Marketable | |
| Green Hill Investments Llc | -- | Marketable | |
| Poling Land Investments Llc | $430,000 | Marketable | |
| Green Hill Investments Llc | -- | Marketable | |
| Decker Todd K | -- | Powell Title Agency Ltd | |
| Decker Todd | $15,500 | -- |
Source: Public Records
Mortgage History
| Date | Status | Borrower | Loan Amount |
|---|---|---|---|
| Previous Owner | Acq Equity Llc | $594,000 | |
| Previous Owner | Acq Equity Llc | $594,000 | |
| Previous Owner | Poling Don D | $60,000 | |
| Previous Owner | Poling Don D | $56,800 | |
| Previous Owner | Poling Land Investments Llc | $430,000 | |
| Previous Owner | Decker Todd K | $43,000 |
Source: Public Records
Tax History Compared to Growth
Tax History
| Year | Tax Paid | Tax Assessment Tax Assessment Total Assessment is a certain percentage of the fair market value that is determined by local assessors to be the total taxable value of land and additions on the property. | Land | Improvement |
|---|---|---|---|---|
| 2024 | $2,577 | $34,340 | $11,800 | $22,540 |
| 2023 | $1,704 | $34,335 | $11,795 | $22,540 |
| 2022 | $940 | $17,680 | $8,190 | $9,490 |
| 2021 | $1,215 | $17,680 | $8,190 | $9,490 |
| 2020 | $1,023 | $17,680 | $8,190 | $9,490 |
| 2019 | $921 | $14,810 | $7,140 | $7,670 |
| 2018 | $856 | $14,810 | $7,140 | $7,670 |
| 2017 | $896 | $14,810 | $7,140 | $7,670 |
| 2016 | $871 | $12,820 | $3,680 | $9,140 |
| 2015 | $793 | $12,820 | $3,680 | $9,140 |
| 2014 | $795 | $12,820 | $3,680 | $9,140 |
| 2013 | $412 | $13,475 | $3,850 | $9,625 |
Source: Public Records
Map
Nearby Homes
- 3018 Nuway Rd
- 1382 Southfield Dr S
- 3060 Durham Dr
- 3072 Bluefield Dr
- 3172 Weirton Dr
- 2685 Bulen Ave
- 2626 Diane Place
- 3369 Norwalk Rd
- 1138 Hilock Rd Unit 35
- 1204 Koebel Rd
- 2512 Kitchner Dr
- 2496 Navarre Rd
- 884 Bruckner Rd
- 1299 Yolanda Dr
- 3551 Groveport Rd
- 1124 Rumsey Rd
- 3302 Hilock Place
- 868 Koebel Ave
- 780 Basswood Rd
- 868 Lawndale Ave
- 1288 Midway Ave
- 1302 Midway Ave
- 1282 Midway Ave
- 1310 Midway Ave
- 1297 Grovewood Dr
- 1303 Grovewood Dr
- 1291 Grovewood Dr
- 1311 Grovewood Dr
- 1274 Midway Ave
- 1283 Grovewood Dr
- 1295 Midway Ave
- 1289 Midway Ave
- 1301 Midway Ave
- 3001 Nuway Rd
- 3007 Nuway Rd
- 1283 Midway Ave
- 1275 Grovewood Dr
- 1309 Midway Ave
- 2993 Nuway Rd
- 1268 Midway Ave