12961 Addison St Sherman Oaks, CA 91423
Estimated Value: $1,361,000 - $1,737,000
3
Beds
2
Baths
1,769
Sq Ft
$849/Sq Ft
Est. Value
About This Home
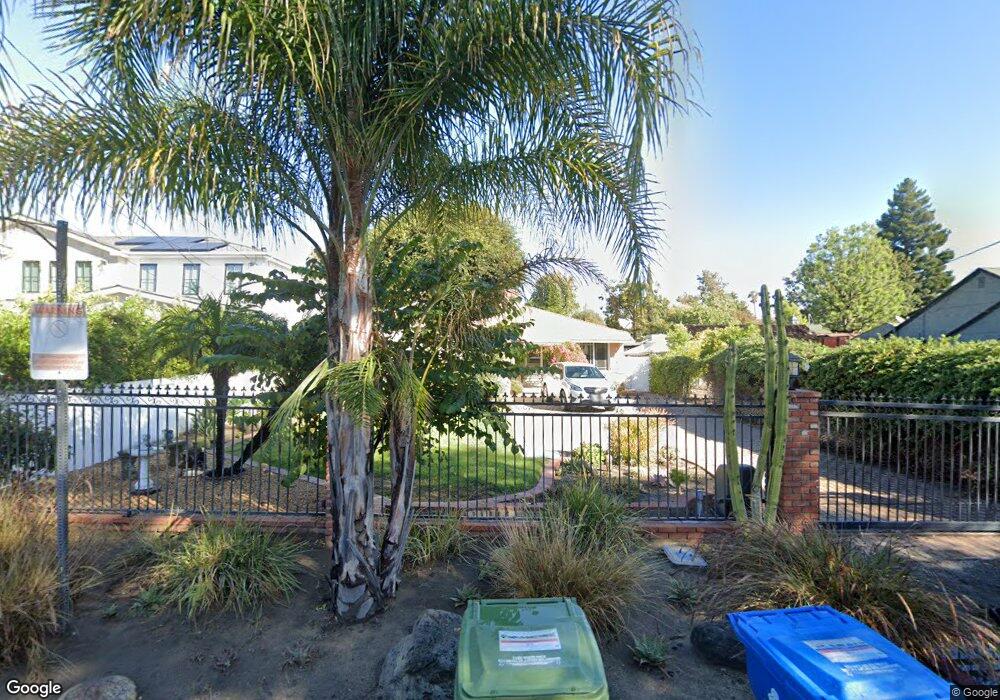
This home is located at 12961 Addison St, Sherman Oaks, CA 91423 and is currently estimated at $1,501,739, approximately $848 per square foot. 12961 Addison St is a home located in Los Angeles County with nearby schools including Ulysses S. Grant Senior High School, Riverside Drive Charter Elementary School, and Louis D. Armstrong Middle School.
Ownership History
Date
Name
Owned For
Owner Type
Purchase Details
Closed on
Mar 23, 2006
Sold by
Mclaughlin Alvin J
Bought by
Mclaughlin Alvin J and Mclaughlin Lucia S
Current Estimated Value
Home Financials for this Owner
Home Financials are based on the most recent Mortgage that was taken out on this home.
Original Mortgage
$250,000
Interest Rate
6.25%
Mortgage Type
New Conventional
Purchase Details
Closed on
Dec 18, 2001
Sold by
Mclaughlin Alvin J
Bought by
Mclaughlin Alvin J and Mclaughlin Lucia S
Home Financials for this Owner
Home Financials are based on the most recent Mortgage that was taken out on this home.
Original Mortgage
$240,000
Interest Rate
7.17%
Purchase Details
Closed on
Feb 24, 1998
Sold by
Mclaughlin Alvin J
Bought by
Mclaughlin Alvin J and Mclaughlin Lucia S
Create a Home Valuation Report for This Property
The Home Valuation Report is an in-depth analysis detailing your home's value as well as a comparison with similar homes in the area
Home Values in the Area
Average Home Value in this Area
Purchase History
| Date | Buyer | Sale Price | Title Company |
|---|---|---|---|
| Mclaughlin Alvin J | -- | Chicago Title Co | |
| Mclaughlin Alvin J | -- | Landsafe Title | |
| Mclaughlin Alvin J | -- | -- |
Source: Public Records
Mortgage History
| Date | Status | Borrower | Loan Amount |
|---|---|---|---|
| Closed | Mclaughlin Alvin J | $250,000 | |
| Closed | Mclaughlin Alvin J | $240,000 | |
| Closed | Mclaughlin Alvin J | $86,000 |
Source: Public Records
Tax History Compared to Growth
Tax History
| Year | Tax Paid | Tax Assessment Tax Assessment Total Assessment is a certain percentage of the fair market value that is determined by local assessors to be the total taxable value of land and additions on the property. | Land | Improvement |
|---|---|---|---|---|
| 2025 | $3,971 | $316,956 | $179,611 | $137,345 |
| 2024 | $3,971 | $310,742 | $176,090 | $134,652 |
| 2023 | $3,897 | $304,650 | $172,638 | $132,012 |
| 2022 | $3,721 | $298,677 | $169,253 | $129,424 |
| 2021 | $3,667 | $292,822 | $165,935 | $126,887 |
| 2019 | $3,559 | $284,138 | $161,014 | $123,124 |
| 2018 | $3,467 | $278,567 | $157,857 | $120,710 |
| 2016 | $3,297 | $267,752 | $151,728 | $116,024 |
| 2015 | $3,249 | $263,731 | $149,449 | $114,282 |
| 2014 | $3,268 | $258,566 | $146,522 | $112,044 |
Source: Public Records
Map
Nearby Homes
- 5055 Coldwater Canyon Ave Unit 217
- 4938 Morse Ave
- 5050 Coldwater Canyon Ave Unit 306
- 5050 Coldwater Canyon Ave Unit 310
- 13128 Hartsook St
- 5020 Alcove Ave
- 13158 Otsego St
- 13157 Otsego St
- 13033 Magnolia Blvd
- 13117 Magnolia Blvd
- 4859 Coldwater Canyon Ave Unit 12
- 12947 La Maida St
- 4822 Van Noord Ave Unit 6
- 4838 Coldwater Canyon Ave
- 5255 Coldwater Canyon Ave Unit D
- 5252 Coldwater Canyon Ave Unit 214
- 5109 Longridge Ave
- 13232 Magnolia Blvd
- 5032 Bluebell Ave
- 4800 Mary Ellen Ave
- 12949 Addison St
- 13005 Addison St
- 12945 Addison St
- 13011 Addison St
- 12946 Hesby St
- 13000 Hesby St
- 13013 Addison St
- 12943 Addison St
- 12940 Hesby St
- 12939 Addison St
- 13010 Hesby St
- 13019 Addison St
- 12934 Hesby St
- 12960 Addison St
- 13000 Addison St
- 12937 Addison St
- 12946 Addison St
- 12946 Addison St
- 13020 Hesby St
- 12930 Hesby St