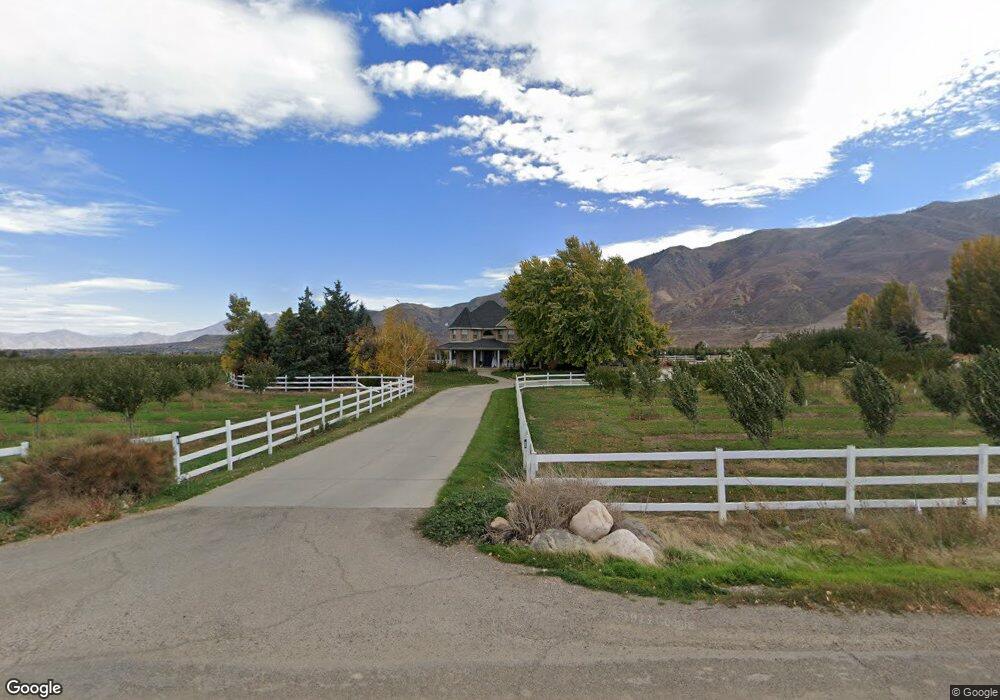
12963 S 5200 W Santaquin, UT 84655
Estimated Value: $980,000 - $1,761,645
5
Beds
3
Baths
4,048
Sq Ft
$334/Sq Ft
Est. Value
About This Home
This home is located at 12963 S 5200 W, Santaquin, UT 84655 and is currently estimated at $1,350,215, approximately $333 per square foot. 12963 S 5200 W is a home with nearby schools including Taylor Elementary School, Mt. Nebo Junior High School, and Valley View Middle School.
Ownership History
Date
Name
Owned For
Owner Type
Purchase Details
Closed on
Dec 15, 2023
Sold by
Utah County
Bought by
Farley Asset Protection Trust
Current Estimated Value
Purchase Details
Closed on
Dec 6, 2023
Sold by
Utah County
Bought by
Farley Asset Protection Trust
Purchase Details
Closed on
Mar 2, 2020
Sold by
Farley Joen M and Farley Nancy Lee
Bought by
Farley John M and Farley Nancy Lee
Purchase Details
Closed on
Nov 14, 2018
Sold by
Prescott Steven M and Prescott Mary Ellen
Bought by
Farley John M and Farley Nancy Lee
Home Financials for this Owner
Home Financials are based on the most recent Mortgage that was taken out on this home.
Original Mortgage
$1,114,146
Interest Rate
4.7%
Mortgage Type
Commercial
Create a Home Valuation Report for This Property
The Home Valuation Report is an in-depth analysis detailing your home's value as well as a comparison with similar homes in the area
Home Values in the Area
Average Home Value in this Area
Purchase History
| Date | Buyer | Sale Price | Title Company |
|---|---|---|---|
| Farley Asset Protection Trust | -- | None Listed On Document | |
| Farley Asset Protection Trust | -- | None Listed On Document | |
| Farley John M | -- | None Available | |
| Farley John M | -- | Vanguard Title Ins Agency Ll |
Source: Public Records
Mortgage History
| Date | Status | Borrower | Loan Amount |
|---|---|---|---|
| Previous Owner | Farley John M | $1,114,146 |
Source: Public Records
Tax History Compared to Growth
Tax History
| Year | Tax Paid | Tax Assessment Tax Assessment Total Assessment is a certain percentage of the fair market value that is determined by local assessors to be the total taxable value of land and additions on the property. | Land | Improvement |
|---|---|---|---|---|
| 2025 | $5,275 | $495,005 | $1,104,200 | $717,200 |
| 2024 | $5,275 | $525,324 | $0 | $0 |
| 2023 | $5,742 | $573,628 | $0 | $0 |
| 2022 | $6,598 | $2,167,500 | $1,121,200 | $1,046,300 |
| 2021 | $6,316 | $1,769,500 | $908,400 | $861,100 |
| 2020 | $5,980 | $1,609,400 | $789,900 | $819,500 |
| 2019 | $5,854 | $1,550,400 | $731,000 | $819,400 |
| 2018 | $6,134 | $1,545,400 | $726,000 | $819,400 |
| 2017 | $5,570 | $449,183 | $0 | $0 |
| 2016 | $5,680 | $448,829 | $0 | $0 |
| 2015 | $5,210 | $403,738 | $0 | $0 |
| 2014 | $5,519 | $404,029 | $0 | $0 |
Source: Public Records
Map
Nearby Homes
- 943 N 200 E Unit 31
- Pine Plan at Stratton Acres
- Willow Plan at Stratton Acres
- Aspen Plan at Stratton Acres
- Cottonwood Plan at Stratton Acres
- 961 N 120 E
- 116 E 840 N
- 933 N 200 E
- 933 N 200 E Unit 32
- 1032 N Apple Seed Ln
- 894 N Apple Seed Ln
- 109 W 930 N
- 41 W 770 N
- McIntosh Plan at The Orchards
- Honey Plan at The Orchards
- Cranford Plan at The Orchards
- Monroe Plan at The Orchards
- Benson Plan at The Orchards
- Gala Plan at The Orchards
- 932 N 160 E Unit 21
- 12864 S 5200 W
- 12986 S 5350 W
- 13025 S 5200 W
- 5104 W 12800 S
- 5080 W 12800 S
- 171 E 990 N
- 5006 W 12800 S
- 147 E 990 N Unit 115
- 148 E 990 N
- 143 E 990 N
- 143 E 990 N Unit 114
- 144 E 990 N Unit 117
- 144 E 990 N
- 139 E 990 N Unit 113
- 140 E 990 N Unit 118
- 941 N 160 E
- 135 E 990 N Unit 112
- 974 N 120 E
- 968 N 120 E
- 960 N 120 E