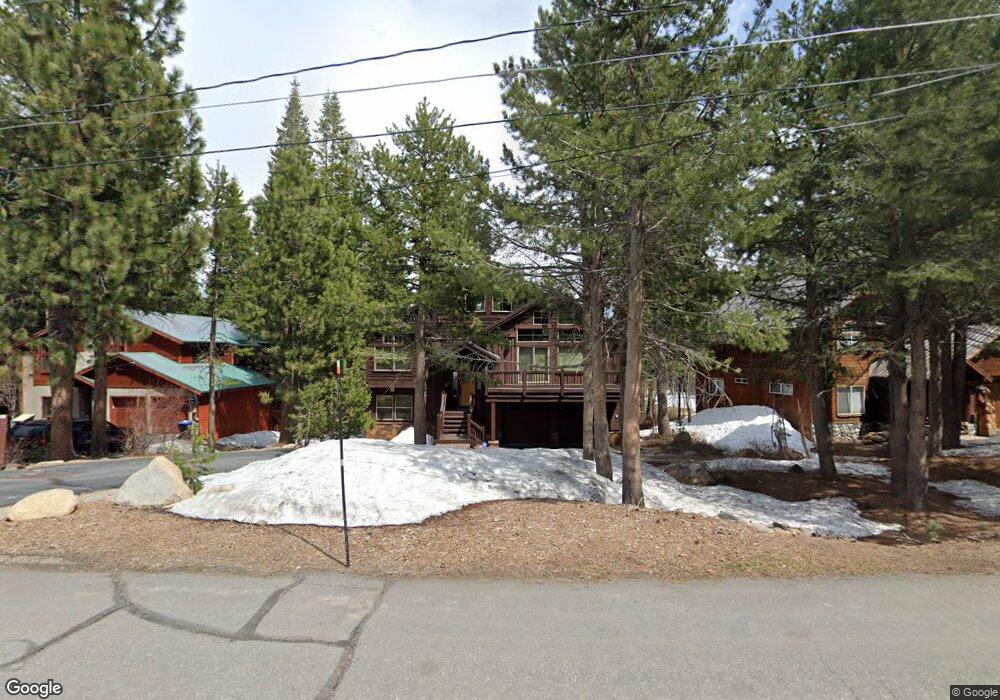
12967 Solvang Way Truckee, CA 96161
Tahoe Donner NeighborhoodEstimated Value: $1,617,000 - $2,011,804
4
Beds
4
Baths
3,609
Sq Ft
$524/Sq Ft
Est. Value
About This Home
This home is located at 12967 Solvang Way, Truckee, CA 96161 and is currently estimated at $1,891,951, approximately $524 per square foot. 12967 Solvang Way is a home located in Nevada County with nearby schools including Truckee Elementary School, Alder Creek Middle School, and Tahoe Truckee High School.
Ownership History
Date
Name
Owned For
Owner Type
Purchase Details
Closed on
Feb 10, 2011
Sold by
Ross Mark H and Ross Jennifer T
Bought by
Ross Mark H and Ross Jennifer T
Current Estimated Value
Purchase Details
Closed on
Jun 15, 2009
Sold by
Gamet D Steve and Gamet Charlene
Bought by
Ross Mark H and Ross Jennifer T
Home Financials for this Owner
Home Financials are based on the most recent Mortgage that was taken out on this home.
Original Mortgage
$417,000
Outstanding Balance
$264,176
Interest Rate
4.82%
Mortgage Type
Purchase Money Mortgage
Estimated Equity
$1,627,775
Purchase Details
Closed on
Oct 26, 2005
Sold by
Zootis Oconnor Wayne and Zootis Oconnor Betty
Bought by
Gamet D Steve and Gamet Charlene
Purchase Details
Closed on
Jan 4, 2001
Sold by
Knapp Shirley K
Bought by
Oconnor Wayne and Zootis Oconnor Betty
Purchase Details
Closed on
Dec 26, 2000
Sold by
Au Robert K and Au Ina Y
Bought by
Oconnor Wayne and Zootis Oconnor Betty
Create a Home Valuation Report for This Property
The Home Valuation Report is an in-depth analysis detailing your home's value as well as a comparison with similar homes in the area
Home Values in the Area
Average Home Value in this Area
Purchase History
| Date | Buyer | Sale Price | Title Company |
|---|---|---|---|
| Ross Mark H | -- | None Available | |
| Ross Mark H | $1,000,000 | First American Title Company | |
| Gamet D Steve | $295,000 | First American Title | |
| Zootis Oconnor Wayne | -- | First American Title | |
| Oconnor Wayne | -- | First American Title Ins Co | |
| Oconnor Wayne | $120,000 | First American Title Ins Co |
Source: Public Records
Mortgage History
| Date | Status | Borrower | Loan Amount |
|---|---|---|---|
| Open | Ross Mark H | $417,000 |
Source: Public Records
Tax History
| Year | Tax Paid | Tax Assessment Tax Assessment Total Assessment is a certain percentage of the fair market value that is determined by local assessors to be the total taxable value of land and additions on the property. | Land | Improvement |
|---|---|---|---|---|
| 2025 | $15,057 | $1,288,726 | $322,908 | $965,818 |
| 2024 | $14,970 | $1,263,458 | $316,577 | $946,881 |
| 2023 | $14,970 | $1,238,685 | $310,370 | $928,315 |
| 2022 | $14,629 | $1,214,398 | $304,285 | $910,113 |
| 2021 | $14,073 | $1,190,528 | $298,260 | $892,268 |
| 2020 | $13,994 | $1,178,321 | $295,202 | $883,119 |
| 2019 | $14,041 | $1,155,217 | $289,414 | $865,803 |
| 2018 | $13,238 | $1,132,567 | $283,740 | $848,827 |
| 2017 | $12,988 | $1,110,363 | $278,179 | $832,184 |
| 2016 | $12,897 | $1,087,821 | $271,954 | $815,867 |
| 2015 | $11,886 | $1,007,000 | $252,000 | $755,000 |
| 2014 | -- | $924,000 | $231,000 | $693,000 |
Source: Public Records
Map
Nearby Homes
- 12987 Hillside Dr
- 12621 Peregrine Dr
- 13872 Alder Creek Rd
- 12574 Saint Moritz Ln
- 12817 Stockholm Way
- 13074 Stockholm Way
- 12787 Stockholm Way
- 14070 Alder Creek Rd
- 12996 Oberwald Way
- 13420 Northwoods Blvd
- 13854 Northwoods Blvd
- 13239 Northwoods Blvd Unit B
- 13205 Northwoods Blvd Unit 2
- 12391 Stockholm Way
- 13938 Northwoods Blvd
- 15407 Wolfgang Rd
- 14258 Glacier View Dr
- 15043 Wolfgang Rd
- 11870 Muhlebach Way Unit 1
- 12802 Northwoods Blvd Unit 437
- 12981 Solvang Way
- 12939 Solvang Way
- 12925 Solvang Way
- 12995 Solvang Way
- 12950 Hillside Dr
- 12938 Hillside Dr
- 12964 Hillside Dr
- 13010 Solvang Way
- 12982 Solvang Way
- 12928 Hillside Dr
- 12911 Solvang Way
- 13009 Solvang Way
- 12974 Hillside Dr
- 12968 Solvang Way Unit 7
- 12968 Solvang Way
- 12914 Hillside Dr
- 12954 Solvang Way
- 13024 Solvang Way
- 12940 Solvang Way
- 12905 Solvang Way
Your Personal Tour Guide
Ask me questions while you tour the home.