Estimated Value: $186,160 - $206,000
3
Beds
2
Baths
1,352
Sq Ft
$146/Sq Ft
Est. Value
About This Home
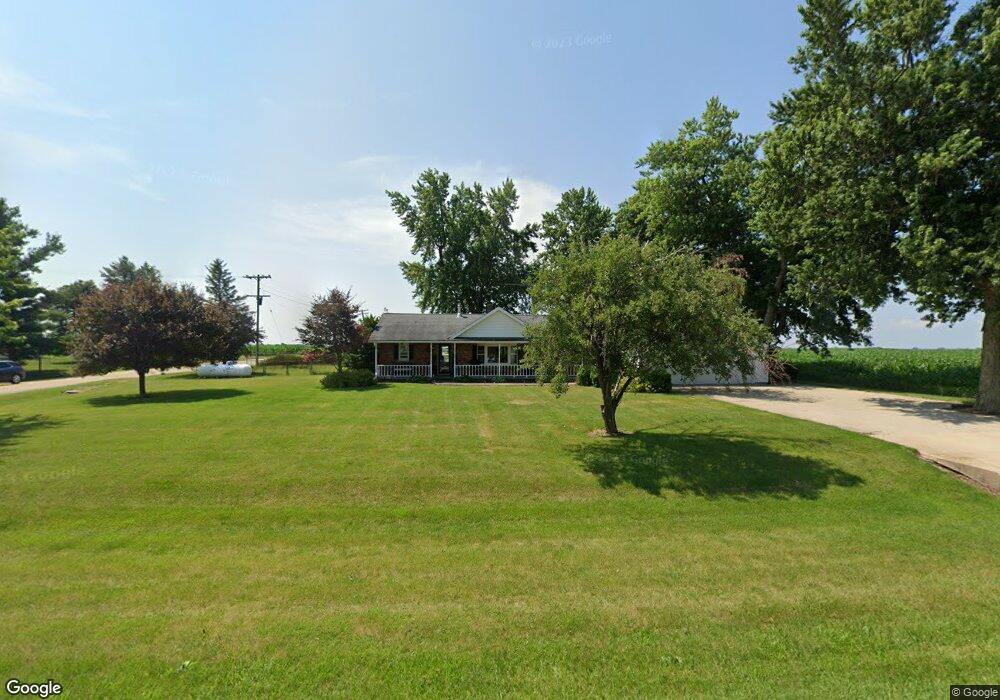
This home is located at 1297 Amboy Rd, Amboy, IL 61310 and is currently estimated at $197,290, approximately $145 per square foot. 1297 Amboy Rd is a home located in Lee County with nearby schools including Amboy Central Elementary School, Amboy Junior High School, and Amboy High School.
Ownership History
Date
Name
Owned For
Owner Type
Purchase Details
Closed on
Apr 25, 2025
Sold by
Hicks Emmitt J and Hicks Kelli M
Bought by
Coughlin Michael R and Nauman Hallie A
Current Estimated Value
Purchase Details
Closed on
Aug 9, 2018
Sold by
Noble Clifton D
Bought by
Hicks Emmitt J and Gorski Kelli M
Home Financials for this Owner
Home Financials are based on the most recent Mortgage that was taken out on this home.
Original Mortgage
$130,000
Interest Rate
4.5%
Mortgage Type
New Conventional
Purchase Details
Closed on
May 20, 2010
Sold by
Brownlee Steven D and Brownlee Catherine A
Bought by
Noble Clifton D
Home Financials for this Owner
Home Financials are based on the most recent Mortgage that was taken out on this home.
Original Mortgage
$138,775
Interest Rate
5.14%
Mortgage Type
New Conventional
Create a Home Valuation Report for This Property
The Home Valuation Report is an in-depth analysis detailing your home's value as well as a comparison with similar homes in the area
Home Values in the Area
Average Home Value in this Area
Purchase History
| Date | Buyer | Sale Price | Title Company |
|---|---|---|---|
| Coughlin Michael R | $190,000 | Kl | |
| Hicks Emmitt J | $140,000 | None Available | |
| Noble Clifton D | $136,000 | None Available |
Source: Public Records
Mortgage History
| Date | Status | Borrower | Loan Amount |
|---|---|---|---|
| Previous Owner | Hicks Emmitt J | $130,000 | |
| Previous Owner | Noble Clifton D | $138,775 |
Source: Public Records
Tax History Compared to Growth
Tax History
| Year | Tax Paid | Tax Assessment Tax Assessment Total Assessment is a certain percentage of the fair market value that is determined by local assessors to be the total taxable value of land and additions on the property. | Land | Improvement |
|---|---|---|---|---|
| 2024 | $3,226 | $50,025 | $4,147 | $45,878 |
| 2023 | $2,875 | $43,500 | $3,606 | $39,894 |
| 2022 | $2,570 | $38,457 | $3,308 | $35,149 |
| 2021 | $2,480 | $36,983 | $3,272 | $33,711 |
| 2020 | $2,441 | $35,906 | $3,177 | $32,729 |
| 2019 | $2,442 | $34,860 | $3,084 | $31,776 |
| 2018 | $2,334 | $33,200 | $2,937 | $30,263 |
| 2017 | $1,916 | $30,690 | $2,940 | $27,750 |
| 2016 | $1,903 | $30,690 | $2,940 | $27,750 |
| 2015 | $1,899 | $30,690 | $2,940 | $27,750 |
| 2014 | $1,892 | $30,690 | $2,940 | $27,750 |
| 2013 | $1,866 | $31,969 | $2,417 | $29,552 |
Source: Public Records
Map
Nearby Homes
- 227 W Provost St
- 1061 Robbins Rd
- 25 W Main St
- 133 N East Ave
- 390 N East Ave
- 16 W Wasson Rd Unit 19
- 16 W Wasson Rd
- 300 E Division St
- 904 Walton Rd
- 1713 Nauman Rd
- 1280 Hickory St
- 1801 Lee Center Rd
- 1067 Peter Dr
- Lots 7-9 Peter Dr
- 1071 Peter Dr
- 1077 Peter Dr
- 1392 Red Brick Rd
- 29/140 Woodhaven Dr E
- 2/262 Woodhaven Dr E
- 21-204 Woodhaven Dr E